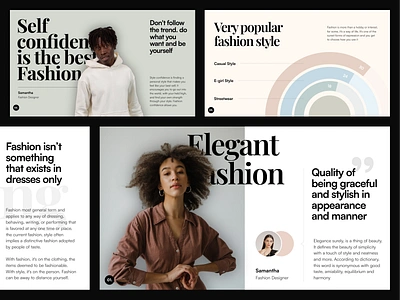
1. Fashion Pitch Deck bold chart clean data deck editorial fashion graphs infographic keynote layout magazine photography pitch power point ppt presentation slide typography whitespace
    View Fashion Pitch Deck
    Fashion Pitch Deck
    386
    205k
  2. Graph Monsters for Pitch (Part 1) 3d c4d character character design charts cinema4d design graphs octane render pitch stickers
    View Graph Monsters for Pitch (Part 1)
    Graph Monsters for Pitch (Part 1)
    1k
    126k
  3. Notebook Stationery Line 2023 calendar chart cooking graph paper graphs guide guides industrial journal journals measurements notebook notebooks paper paper line scientific stationery stationery line vintage
    View Notebook Stationery Line
    Notebook Stationery Line
    43
    11.1k
  4. Graph Monsters for Pitch (Part 2) 3d c4d character cinema4d graph graphs hero monster octane pitch stickers
    View Graph Monsters for Pitch (Part 2)
    Graph Monsters for Pitch (Part 2)
    1.3k
    174k
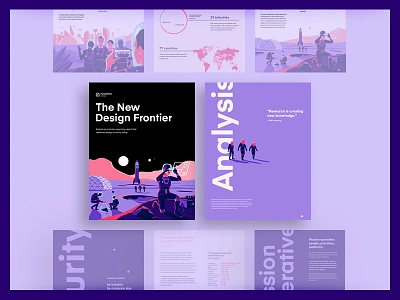
  5. InVision - New Design Frontier PDF brand clean color graphs illustration infographic pdf print report type
    View InVision - New Design Frontier PDF
    InVision - New Design Frontier PDF
    638
    145k
  6. šŸ“Š Traefik Labs - Survey Report charts data visualization graphic design graphs pdf print report survey
    View šŸ“Š Traefik Labs - Survey Report
    šŸ“Š Traefik Labs - Survey Report
    9
    5k
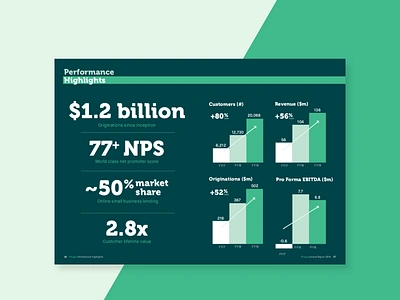
  7. Prospa Annual Report annual report australia design graphs green illustration layout layout design new zealand numbers nz print print design prospa typography
    View Prospa Annual Report
    Prospa Annual Report
    111
    45.1k
  8. Storytelling with Data book charts flat illustration graphs illustration illustration art illustration design isometric isometric illustration layout open book vector vector illustration
    View Storytelling with Data
    Storytelling with Data
    22
    5.1k
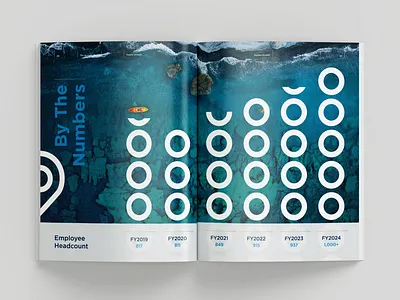
  9. The Bonadio Group Annual Report: By The Numbers accounting annual report bar graph branding charts circles corporate communication graphic design graphs headcount infographic inspiration kyak layout numbers print spread water
    View The Bonadio Group Annual Report: By The Numbers
    The Bonadio Group Annual Report: By The Numbers
    1
    159
  10. WIP branding brochure design cancer data data visualization design digital graphic design graphs healthcare infographic infographic design information design information technology layout design logo plot print print design typography
    View WIP
    WIP
    26
    9.1k
  11. Document Design - Agency Brand brand branding document graphs minimal paper print purple survey
    View Document Design - Agency Brand
    Document Design - Agency Brand
    20
    5.5k
  12. Infographics 100000 branding cancer charts clinical data visualization design genes genomics graphs health iconography infographic layout design layout exploration typography
    View Infographics 100000
    Infographics 100000
    25
    6.4k
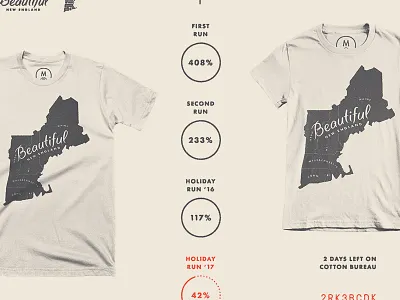
  13. Beautiful New England Holiday '17 circles duotone graphs infographic layout new england percentage stamp tee shirts
    View Beautiful New England Holiday '17
    Beautiful New England Holiday '17
    165
    26.1k
  14. Adobe Super Bowl Infographic adobe charts data graphs infographic print super bowl
    View Adobe Super Bowl Infographic
    Adobe Super Bowl Infographic
    20
    2.1k
  15. Vertical Infographic Mockup branding cancer charts clinical data data visualization design genes genomics graphs health healthcare iconography infographic poster research science study typography vector
    View Vertical Infographic Mockup
    Vertical Infographic Mockup
    30
    8.3k
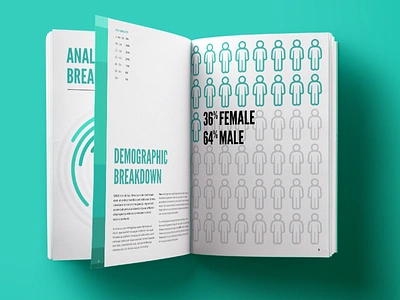
  16. An analysis of a customer's personal network analysis charts data graphs print report
    View An analysis of a customer's personal network
    An analysis of a customer's personal network
    22
    2.5k
  17. Peep Into Our Community data visualization graphs icons infographic information design layout print
    View Peep Into Our Community
    Peep Into Our Community
    26
    2.5k
  18. Stats Page - unused (V2) booklet branding data graphs minimal print simple stats
    View Stats Page - unused (V2)
    Stats Page - unused (V2)
    20
    2.2k
  19. Sexy Corporate Report booklet brochure charts corporate report graphs illustrator photography print design type
    View Sexy Corporate Report
    Sexy Corporate Report
    13
    3.9k
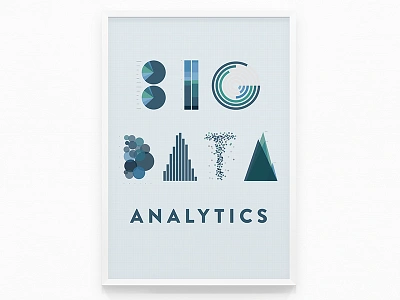
  20. Big Data Analytics Poster big data charts data data visualizations graphs illustration logo poster
    View Big Data Analytics Poster
    Big Data Analytics Poster
    27
    5.6k
  21. Amplitude Full Page Ad ad amplitude branding graphic design graphs marketing page print product
    View Amplitude Full Page Ad
    Amplitude Full Page Ad
    27
    2.8k
  22. Smart Equity agency branding branding design dark data design finance financial services flyer folder folder design graph graphs identity infographic numbers scheme visual identity visualization yellow
    View Smart Equity
    Smart Equity
    13
    3.6k
  23. ANDE Annual Report annual report art direction bold colorful creative direction editorial graphs infographic ngo nonprofit print design typography
    View ANDE Annual Report
    ANDE Annual Report
    50
    5.9k
  24. City Comparison - Hops & Corn charts city comparison data design graphs indianapolis information milwaukee print visualization viz
    1
    View City Comparison - Hops & Corn
    City Comparison - Hops & Corn
    12
    2.9k
Loading moreā€¦