1. Sense. E-learning Dashboard 2d anna fesenko barchart charts clean dashboard design design app e learning gotoinc illustration knowledge learning linechart minimal piechart study ui ux widgets
    View Sense. E-learning Dashboard
    Sense. E-learning Dashboard
    112
    5.3k
  2. Line chart graph animation. aftereffects animation colors dark flat graph interface linechart lines minimal stats ui
    View Line chart graph animation.
    Line chart graph animation.
    75
    13.1k
  3. LineChart aftereffects animation chart linechart sketch
    View LineChart
    LineChart
    92
    4.4k
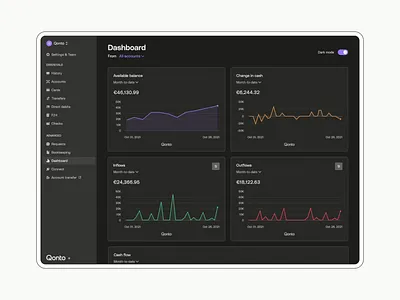
  4. Redesigning our analytics dashboard analytics bankapp barchart cards charts combochart dashboard data datavisualization dataviz diagram donutchart finance financial fintech graphics interface design linechart qonto statistics
    View Redesigning our analytics dashboard
    Redesigning our analytics dashboard
    91
    41k
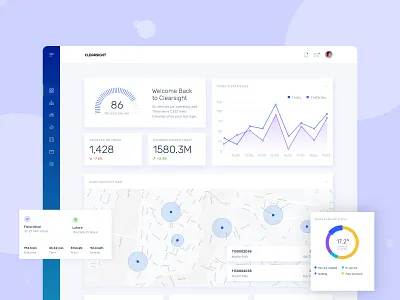
  5. IoT Company Dashboard UI Design app dashboad dashboard design dashboard ui google maps graphics iot linechart map overview pie chart speedometer web app design website
    View IoT Company Dashboard UI Design
    IoT Company Dashboard UI Design
    80
    31.2k
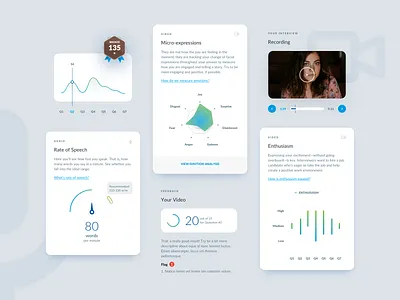
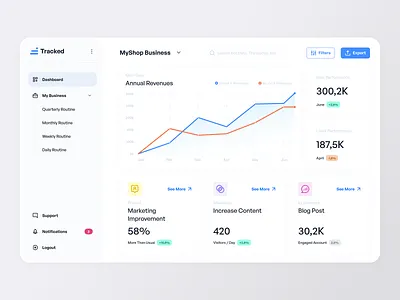
  6. Tracked ⌁ Business Goal Tracking Dashboard blue branding business button chart dashboard design dropdown flat goal gradient graphic graphic design green linechart logo percent percentage red ui
    View Tracked ⌁ Business Goal Tracking Dashboard
    Tracked ⌁ Business Goal Tracking Dashboard
    84
    37k
  7. Quinncia Interface app barchart chart dashboard data data visualization donut graphs interface linechart meter native app pointer score spider ui ux video wab app web
    View Quinncia Interface
    Quinncia Interface
    44
    20.1k
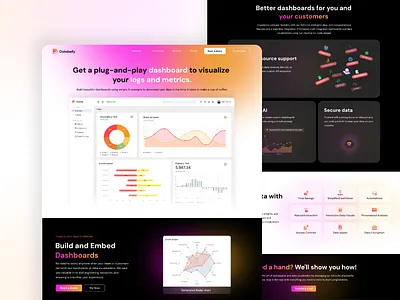
  8. Minimalized Website Design for a Product like Power BI app barchart branding chart dashboard data design graphic design icon illustration linechart logo powerbi ui ux vector webdesign website
    View Minimalized Website Design for a Product like Power BI
    Minimalized Website Design for a Product like Power BI
    4
    2.9k
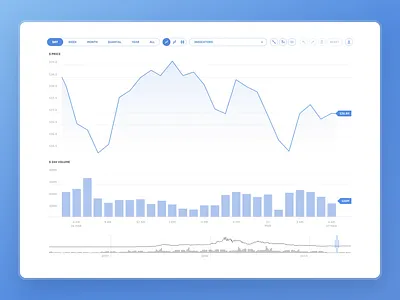
  9. Xchange – Responsive Chart for Crypto Platform animation app bar bargraph bitcoin chat crypto cryptocurrency ethereum flat linechart responsive responsive design ui ux
    View Xchange – Responsive Chart for Crypto Platform
    Xchange – Responsive Chart for Crypto Platform
    75
    12.8k
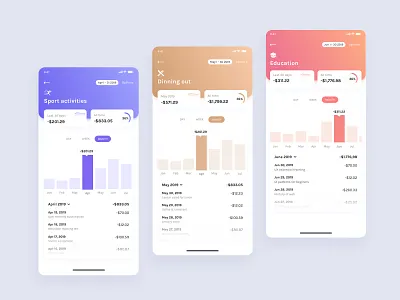
  10. Category Transactions History account app bank budget clean expenses flat gradients graph history illustration income linechart planner tracker ui ux vector web
    View Category Transactions History
    Category Transactions History
    58
    28.7k
  11. Line Chart: Tooltip animation chart gif interactive line chart tooltip ui user interface ux
    View Line Chart: Tooltip
    Line Chart: Tooltip
    32
    5.1k
  12. Xchange – Chart Views for Crypto Platform 2020 trend animation bargraph bitcoin btc candles chart crypto crypto exchange cryptocurrency dark ui design ethereum exchange flat linechart mobile money ui ux
    View Xchange – Chart Views for Crypto Platform
    Xchange – Chart Views for Crypto Platform
    82
    11.8k
  13. Xchange – Chart Period Mobile for Crypto Platform 2020 trend animation bargraph bitcoin btc candles chart crypto crypto exchange cryptocurrency exchange dark app dark ui linechart mobile mobile app mobile ui money
    View Xchange – Chart Period Mobile for Crypto Platform
    Xchange – Chart Period Mobile for Crypto Platform
    60
    6.4k
  14. Medical patient view - Dashboard dashboard heart illustration linechart medical report ui
    View Medical patient view - Dashboard
    Medical patient view - Dashboard
    0
    140
  15. Data Science Application barchart dashboard data data science design graphicdesign graphics interface light linechart minimal ui user experience ux violet web web app web design web studio widgets
    View Data Science Application
    Data Science Application
    27
    6k
  16. Analytics Icons analyse analytics barchart chart compare forecast icon illustration linechart logo predict transform
    View Analytics Icons
    Analytics Icons
    2
    2.5k
  17. Xchange – Chart Period Mobile for Crypto Platform — Prototype 2020 trend animation app bitcoin chart crypto cryptocurrency dark mode dark theme dark ui design exchange flat linechart mobile money scale ui ux video
    View Xchange – Chart Period Mobile for Crypto Platform — Prototype
    Xchange – Chart Period Mobile for Crypto Platform — Prototype
    77
    17.4k
  18. Movie Data Visualizations barchart chart dataisbeautiful datavisualization dataviz imdb linechart movies piechart
    View Movie Data Visualizations
    Movie Data Visualizations
    2
    1.4k
  19. Baby Healthcare Infographic Design barchart care chart design grafik health illustration illustrator infografik infographic infographic design istatistik linechart piechart statistics tasarım
    View Baby Healthcare Infographic Design
    Baby Healthcare Infographic Design
    1
    1.5k
  20. Admin Dashboard admin animation chart dashboard linechart motion graphics piechart ui
    View Admin Dashboard
    Admin Dashboard
    7
    5.7k
  21. Chart Line Chart - Graphic Chart - Doughnut Chart chart chart design charts doughnut chart glassmorphism graphic design grapich chart grapich chart hireme linechart rectangles uiuxdesign
    View Chart Line Chart - Graphic Chart - Doughnut Chart
    Chart Line Chart - Graphic Chart - Doughnut Chart
    1
    1.9k
  22. Animated graph animated data gif graph identity linechart motion tv type
    View Animated graph
    Animated graph
    14
    2.6k
  23. Cyber Security Ratio application barchart chart cyber security dashboard design desktop figma illustration linechart product ratio report result successchart ui ux
    View Cyber Security Ratio
    Cyber Security Ratio
    0
    57
Loading more…