Dribbble: the community for graphic design
Shots
Shots
Designers
Explore
Popular
New and Noteworthy
Product Design
Web Design
Animation
Branding
Illustration
Mobile
Typography
Print
Hire a Designer
Browse Designers
Submit a Project Brief
Post a Job
Hiring on Dribbble
Find Jobs
Blog
Sign up
Log in
Severin Landolt
Switzerland
Get in touch
Follow
Following
Blocked
Work
Collections
Liked Shots
About
Recent Shots
Recent Shots
Popular Shots
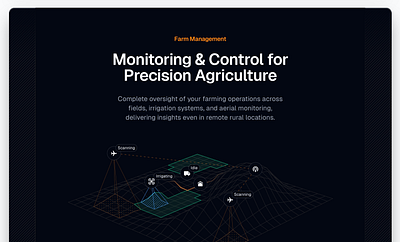
View Dark Feature Section
Dark Feature Section
Like
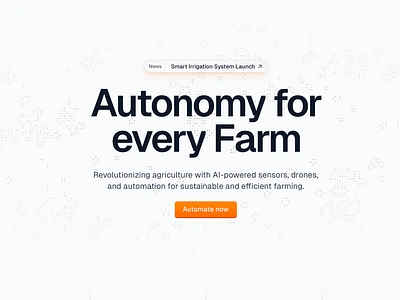
View Hero Section
Hero Section
Like
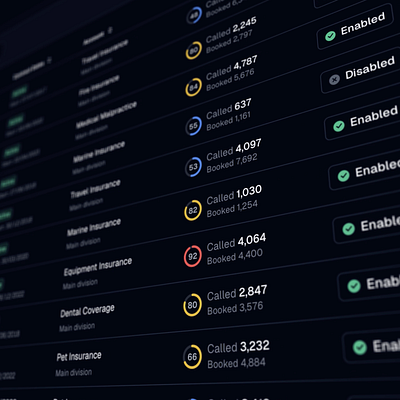
View Table Dark Mode
Table Dark Mode
Like
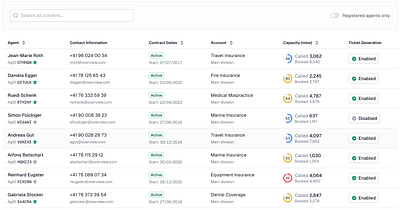
View Double Row Table
Double Row Table
Like
View Chip with Logo
Chip with Logo
Like
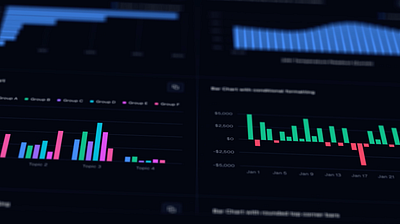
View Charts
Charts
Like
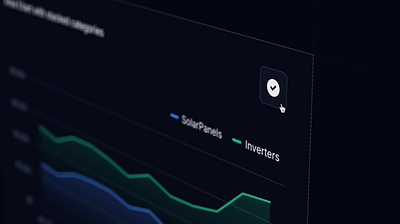
View Copy-to-clipboard
Copy-to-clipboard
Like
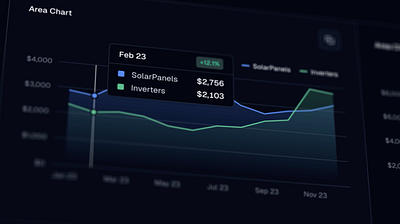
View Area Chart with Tooltip
Area Chart with Tooltip
Like
Shot Link
View Database Launch Video
Database Launch Video
Like
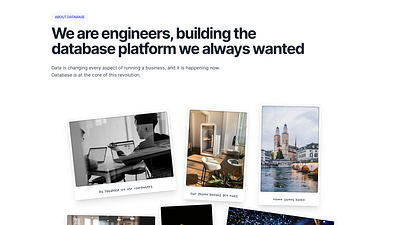
View About page (Team Section)
About page (Team Section)
Like
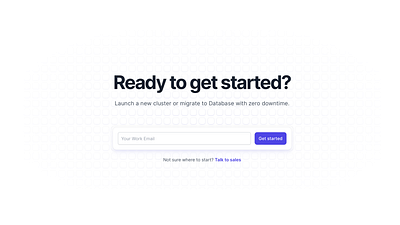
View Call to action (CTA)
Call to action (CTA)
Like
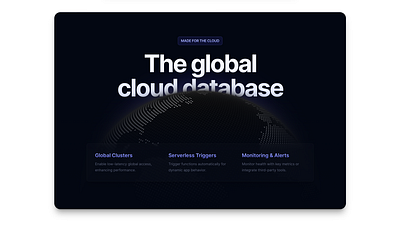
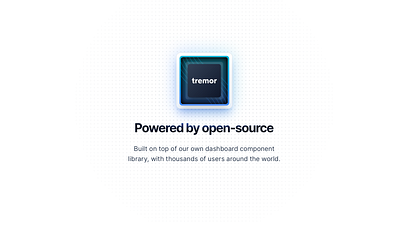
View Feature Section
Feature Section
Like
Shot Link
View Date Picker & Date Range Picker 📅
Date Picker & Date Range Picker 📅
Like
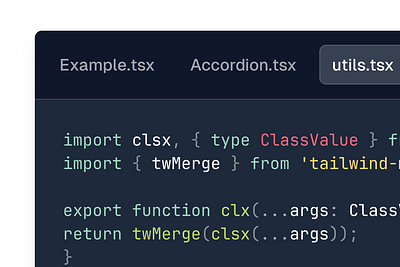
View Code Block with Tabs
Code Block with Tabs
Like
View Footer experiment
Footer experiment
Like
Shot Link
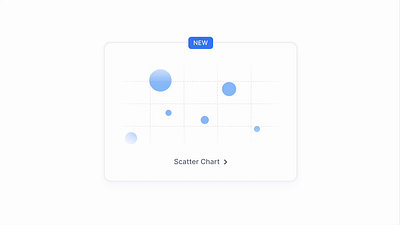
View Interactive Scatter Chart Thumbnail
Interactive Scatter Chart Thumbnail
Like
View Hero Component for Tremor
Hero Component for Tremor
Like
View Metallic Icons
Metallic Icons
Like
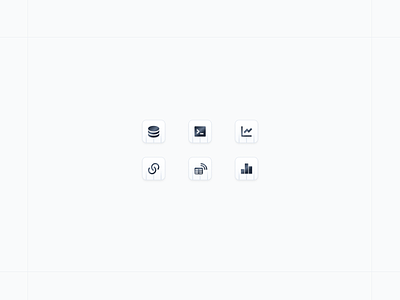
View Analytics Icons
Analytics Icons
Like
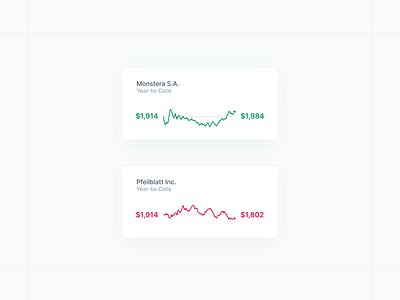
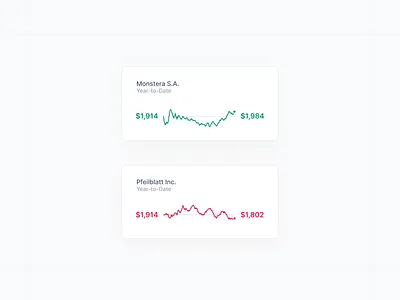
View Tiny Charts – an alternative to Sparklines (4)
Tiny Charts – an alternative to Sparklines (4)
Like
View My 2023 Memoji
My 2023 Memoji
Like
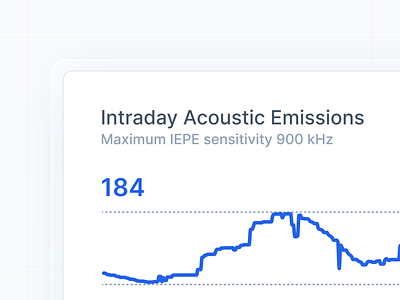
View KPI Card with Color Indication
KPI Card with Color Indication
Like
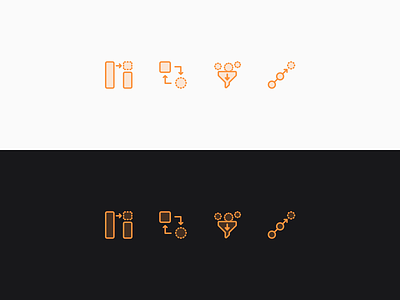
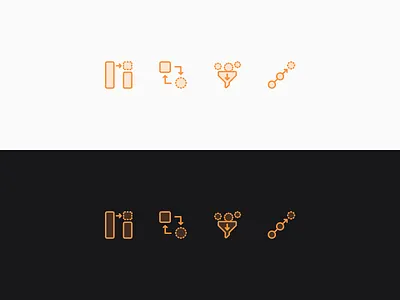
View Some custom icons for a presentation.
Some custom icons for a presentation.
Like
View Leftovers: GitHub Gradient Cover
Leftovers: GitHub Gradient Cover
Like
← Prev
Next →
Sign up to continue
Loading more…
Previous
Next
Loading…