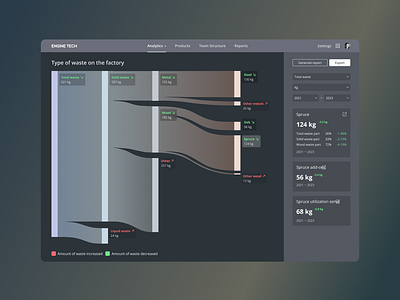
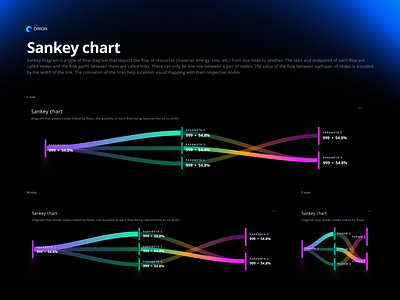
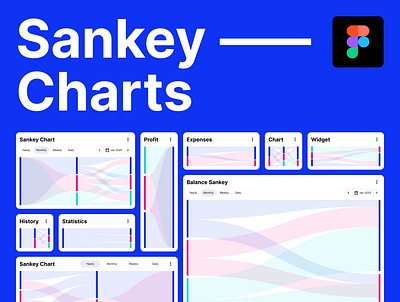
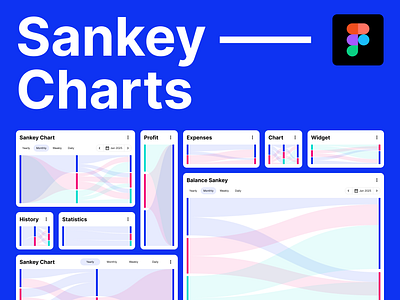
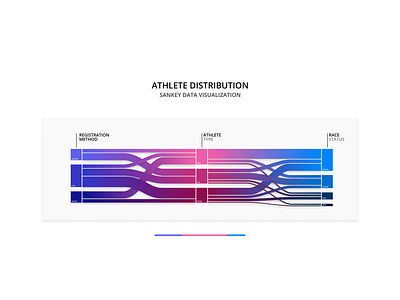
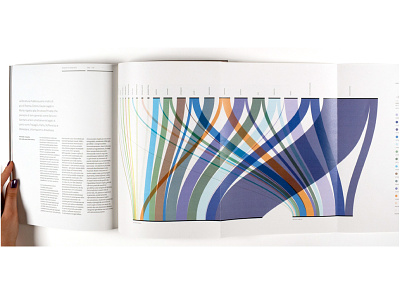
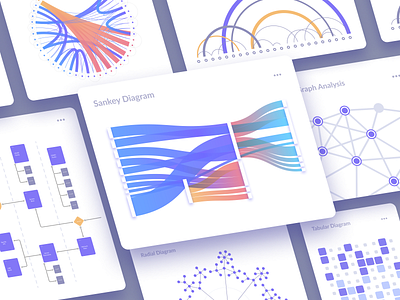
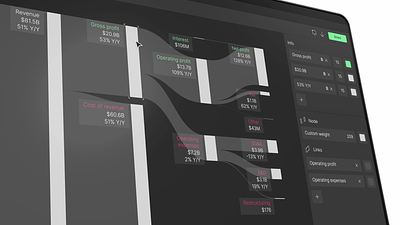
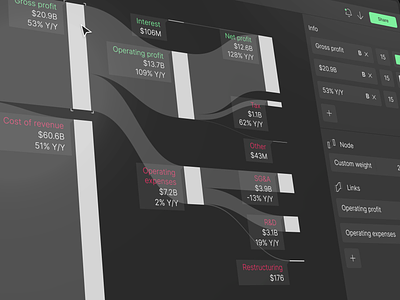
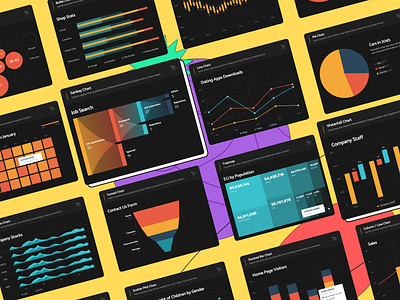
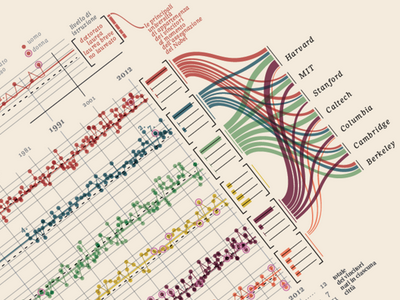
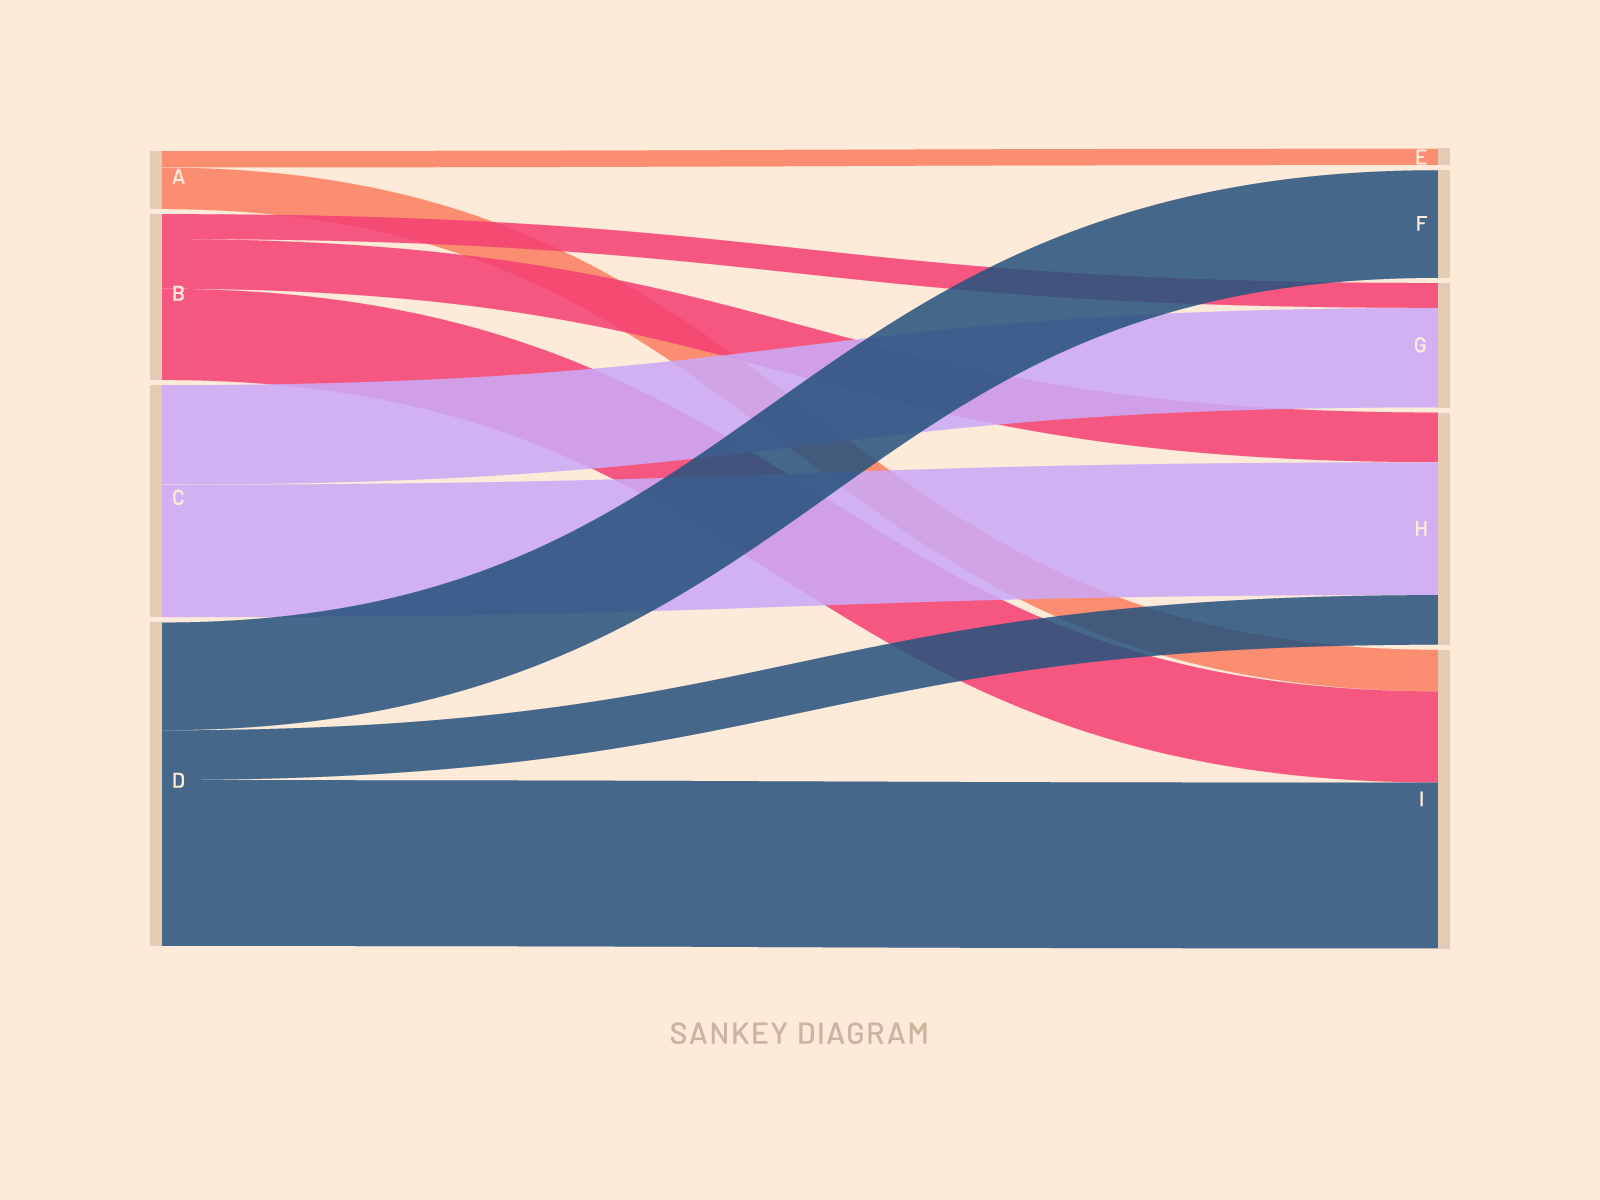
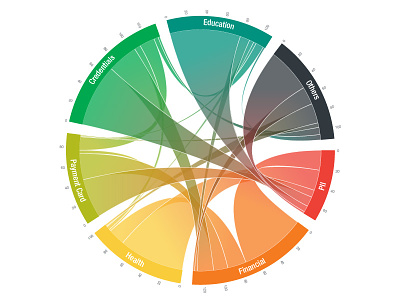
Sankey

Inspirational designs, illustrations, and graphic elements from the world’s best designers.
Want more inspiration? Browse our search results...

  1. Grant management software | Grant tracking | Analysis dashboard ai analysis cards charts colors dark mode dashboard finance grant graph indicators layout logo management overview pie chart product design saas sankey table
    View Grant management software | Grant tracking | Analysis dashboard
    Grant management software | Grant tracking | Analysis dashboard
    503
    61.9k
  2. Big Tech's Response to COVID-19 3d chart covid19 donations infographic isometric pandemic sankey tech
    View Big Tech's Response to COVID-19
    Big Tech's Response to COVID-19
    18
    2.4k
  3. Sankey diagram chart interaction sankey ui ux
    View Sankey diagram
    Sankey diagram
    5
    1.5k
  4. Campaign Dashboard analytics campaigns charts dark theme dashboard diagram illustration monitoring sankey teal ui
    View Campaign Dashboard
    Campaign Dashboard
    13
    3.3k
  5. Application Security Platform charts cyber cybersecurity dashboard dataviz enterprise sankey ui ux
    1
    View Application Security Platform
    Application Security Platform
    37
    12.7k
  6. Interactive Sankey Timeline (Career Paths) analytics career path data visualization data viz job seeker job title page job titles levels path paths sankey timeline
    View Interactive Sankey Timeline (Career Paths)
    Interactive Sankey Timeline (Career Paths)
    58
    27.1k
  7. Pathing Rule Builder analysis analytics app builder chart dashboard diagram flow graph pathing sankey ui web wizard
    View Pathing Rule Builder
    Pathing Rule Builder
    217
    208k
  8. Application Security Platform branding chart cyber cyber security dashboard data data visualization dataviz design line organization sankey ui ux
    View Application Security Platform
    Application Security Platform
    21
    2.5k
  9. Sankey Chart / Orion UI Kit 3d animation bigdata branding chart color dark dashboard data dataviz desktop graph graphic design infographic logo motion graphics sankey statistic template ui
    View Sankey Chart / Orion UI Kit
    Sankey Chart / Orion UI Kit
    339
    104k
  10. Sankey Charts widgets kit for figma card chart data design kit data flow design figma figma flow kit figma sankey charts figma sankey widgets figma template kit path sankey sankey cards sankey charts sankey figma kit sankey style sankey widgets template visuals widgets
    View Sankey Charts widgets kit for figma
    Sankey Charts widgets kit for figma
    2
    1.2k
  11. A dashboard interface for visualizing server traffic analytic animation circle chart components dashboard interface dataviz dynamic graphic infographic progress sankey template trend ui web design widgets
    View A dashboard interface for visualizing server traffic
    A dashboard interface for visualizing server traffic
    2
    1.9k
  12. Triathlon | Sankey visualization charts component data data vis design diagram flow graphs interaction interface pattern sankey triathlon ui ux visualization web design
    View Triathlon | Sankey visualization
    Triathlon | Sankey visualization
    8
    2.9k
  13. Lots of Charts area bar canvas chart column dashboard data visualization data viz graph heatmap indiana indianapolis innovatemap line radar sankey stats streamgraph ui visualization
    View Lots of Charts
    Lots of Charts
    148
    80.4k
  14. Sankey Close Up chart close up color data diagram flat flow flow diagram patten sankey statistics
    View Sankey Close Up
    Sankey Close Up
    32
    17.9k
  15. Sales Dashboard analytics chart customdataviz dashboard dataviz design graphic intelligaia interaction interactive kpi sankey storytelling ui user interface ux
    View Sales Dashboard
    Sales Dashboard
    8
    3.3k
  16. sankey chart data datavisualization dataviz diagram graph infographic sankey visualization
    View sankey
    sankey
    26
    4.1k
  17. Infographic report chart data dataviz diagram flows infographic report sankey
    View Infographic report
    Infographic report
    54
    12.3k
  18. JavaScript Diagrams for Apps 3d app chart charts data design diagrams draft flow layout org sankey ui
    View JavaScript Diagrams for Apps
    JavaScript Diagrams for Apps
    6
    3.7k
  19. Sankey diagram software chart data diagram digital dribbble graphic graphic design infographic information product design sankey snaky chart snaky diagram software technology tool ui uiux user interface ux
    View Sankey diagram software
    Sankey diagram software
    22
    9.4k
  20. Visual Data Pack from thePenTool asset chart charts data visulization data viz design asset design resource funnel horizon pie chart premium sankey scatter thepentool tiles treemap
    View Visual Data Pack from thePenTool
    Visual Data Pack from thePenTool
    61
    30.8k
  21. Nobels, no degree chart circle data data visualization datavis graph infographic information sankey visualization
    View Nobels, no degree
    Nobels, no degree
    127
    10.5k
  22. Animated Sankey Diagram | 49 Days of Charts after effects alluvial diagram analytics animated animation chart data data visualisation gif graph minimal motion motion design motion graphics sankey sankey diagram visualization
    View Animated Sankey Diagram | 49 Days of Charts
    Animated Sankey Diagram | 49 Days of Charts
    4
    2.4k
  23. Ravel - Brand Identity alluvial diagram brand identity branding brandmark concept connected data flow flow chart logo logo design logo designer logomark minimalist modern logo professional sankey sankey diagram startup
    View Ravel - Brand Identity
    Ravel - Brand Identity
    4
    2.3k
  24. Chord Diagram chart chord data data visualization rainbow records sankey
    View Chord Diagram
    Chord Diagram
    29
    6.9k
Loading more…