Dribbble: the community for graphic design
Shots
Shots
Designers
Explore
Popular
New and Noteworthy
Product Design
Web Design
Animation
Branding
Illustration
Mobile
Typography
Print
Hire a Designer
Browse Designers
Submit a Project Brief
Post a Job
Hiring on Dribbble
Find Jobs
Blog
Sign up
Log in
datavis
Amazing datavis designs for inspiration
Related:
datavisualization
dataviz
data visualization
visualization
data
charts
New & Noteworthy
Popular
New & Noteworthy
Discover
Animation
Branding
Illustration
Mobile
Print
Product Design
Typography
Web Design
Filters
Clear
Tags
Clear
Color
#faddd1
#fad3d1
#fad1e6
#e5d1fa
#d4d1fa
#d1e3fa
#d1f3fa
#d1faf0
#d1fad7
#ebfad1
#faf9d1
#faefd1
#fae6d1
#f2e2d9
#ffffff
#f4b69c
#f4a09c
#f49cc8
#c69cf4
#a39cf4
#9cc2f4
#9ce5f4
#9cf4df
#9cf4a7
#d4f49c
#f4f19c
#f4dc9c
#f4c89c
#e3c0ac
#e4e4e4
#ee8f66
#ee6d66
#ee66aa
#a866ee
#7166ee
#66a1ee
#66d7ee
#66eece
#66ee78
#bcee66
#eee966
#eeca66
#eeaa66
#d59f80
#b4b4b4
#e86830
#e83a30
#e8308c
#8930e8
#4030e8
#3080e8
#30c9e8
#30e8bd
#30e849
#a5e830
#e8e230
#e8b730
#e88c30
#c67d53
#848484
#c74b16
#c71f16
#c7166f
#6c16c7
#2516c7
#1663c7
#16a9c7
#16c79e
#16c72e
#86c716
#c7c116
#c79816
#c76f16
#a66037
#545454
#913710
#911710
#911051
#4f1091
#1b1091
#104891
#107c91
#109173
#109121
#629110
#918d10
#916f10
#915110
#794628
#242424
#5c230a
#5c0e0a
#5c0a33
#320a5c
#110a5c
#0a2e5c
#0a4e5c
#0a5c49
#0a5c15
#3e5c0a
#5c590a
#5c460a
#5c330a
#4d2c19
#000000
Shot Link
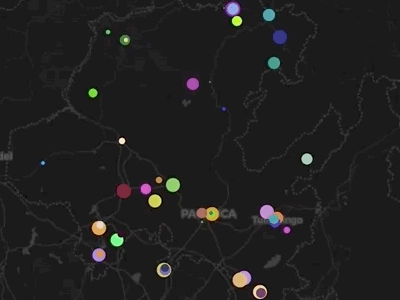
View #30DayMapChallenge Day 26 - Map with a new tool
#30DayMapChallenge Day 26 - Map with a new tool
Like
Carmen Carro
Like
1
1.5k
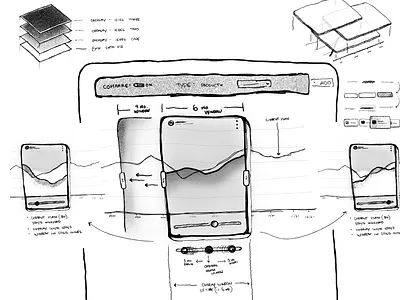
View UI Wireframe | Data Visualization Overlay
UI Wireframe | Data Visualization Overlay
Like
Tyler Wain
Pro
Like
24
5k
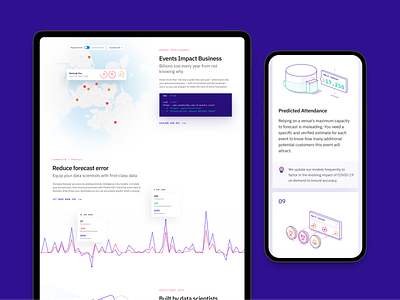
View PredictHQ website
PredictHQ website
Like
Benek Lisefski
Like
25
6.8k
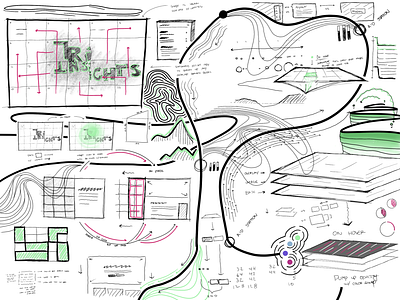
View UI Wireframe | TRI insights
UI Wireframe | TRI insights
Like
Tyler Wain
Pro
Like
14
4.5k
Shot Link
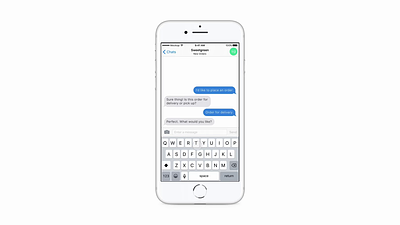
View Rapid prototyping sizzle reel
Rapid prototyping sizzle reel
Like
Hans van de Bruggen
Like
1
993
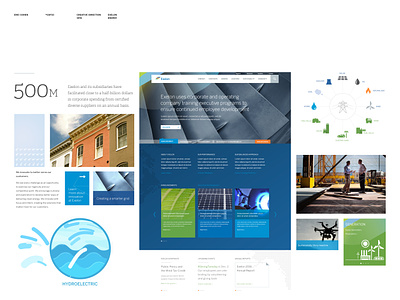
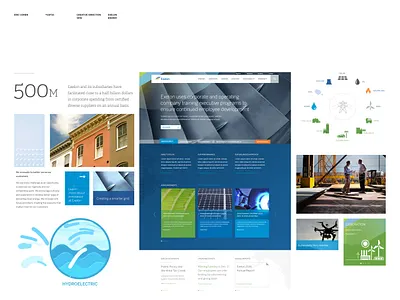
View Energy Digital Strategy
Energy Digital Strategy
Like
Eric Cohen
Pro
Like
1
1.1k
Sign up to continue
Loading more…
Previous
Next
Loading…