1. Delivery service dashboard chart dark dashboard diagram graph map ui ux web
    2
    View Delivery service dashboard
    Delivery service dashboard
    643
    63.5k
  2. Rapid UI Challenge : Smart Home Application bed conditioner graph home house illustration ios lamp stats
    1
    View Rapid UI Challenge : Smart Home Application
    Rapid UI Challenge : Smart Home Application
    729
    49.2k
  3. Dribbble Analytics analytics dashboard dribbble graph stats ui web
    View Dribbble Analytics
    Dribbble Analytics
    736
    40.7k
  4. Inventory Statistics app dashboard graph inventory list statistics stats ui web
    View Inventory Statistics
    Inventory Statistics
    1k
    82.6k
  5. Fluent Design Email App 3d blur chart dashboard fluent graph illustration inbox material metro web windows
    3
    View Fluent Design Email App
    Fluent Design Email App
    1.7k
    169k
  6. Financial App - iOS analytics app chart dashboard finance flat graph ios iphone statistics ui ux
    View Financial App - iOS
    Financial App - iOS
    536
    42.4k
  7. SmartHome App app chart energy gauge graph home house indicator ios mobile remote statistics
    View SmartHome App
    SmartHome App
    1.1k
    79.1k
  8. Trello Atlassian - Stats bank chart cryptocurrency dashboard finance financial fintech gauge graph map statistics stats
    View Trello Atlassian - Stats
    Trello Atlassian - Stats
    1k
    107k
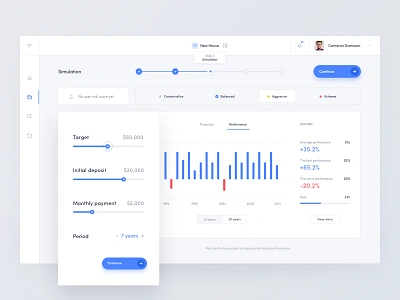
  9. Robo Advisor - Projection bar chart dashboard finance financial gauge graph icons onboarding progress bar statistics stats steps
    View Robo Advisor - Projection
    Robo Advisor - Projection
    3.5k
    458k
  10. Trello Atlassian - Members cards dashboard graph profile sidebar statistics stats tables task ticket trello ui
    View Trello Atlassian - Members
    Trello Atlassian - Members
    2k
    211k
  11. Robo Advisor Web App bank chart cryptocurrency dashboard finance financial fintech gauge graph map statistics stats
    View Robo Advisor Web App
    Robo Advisor Web App
    5.2k
    482k
  12. Robo Advisor - Message Center attachment dashboard email finance financial gauge graph inbox messages robo advisor statistics
    View Robo Advisor - Message Center
    Robo Advisor - Message Center
    1.5k
    173k
  13. Robo Advisor - Projection, List and Questionnaire bank chart cryptocurrency dashboard finance financial fintech gauge graph map statistics stats
    View Robo Advisor - Projection, List and Questionnaire
    Robo Advisor - Projection, List and Questionnaire
    2.5k
    286k
  14. SmartHome App app chart energy gauge graph home house indicator ios mobile remote statistics
    View SmartHome App
    SmartHome App
    2.2k
    152k
  15. Server Dashboard branding dashboard data graph grid ios layout mockup palette product typography ui ui kit
    1
    View Server Dashboard
    Server Dashboard
    2.9k
    305k
  16. RedMetrics Homepage charts data graphs hero homepage icons illustration landing responsive ui web web design
    View RedMetrics Homepage
    RedMetrics Homepage
    313
    15.4k
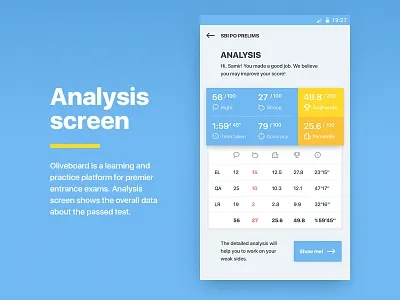
  17. App, part 1 — “Oliveboard” android app banking chart data design fireart fireart studio interface ui
    View App, part 1 — “Oliveboard”
    App, part 1 — “Oliveboard”
    377
    16.1k
  18. Dashboard Card Concepts admin analytics dashboard data fynder reports ui ux
    View Dashboard Card Concepts
    Dashboard Card Concepts
    493
    46.9k
  19. Sports & health app dashboard data fitness flat graph health medical running simple sport ui ux
    View Sports & health app
    Sports & health app
    586
    44.6k
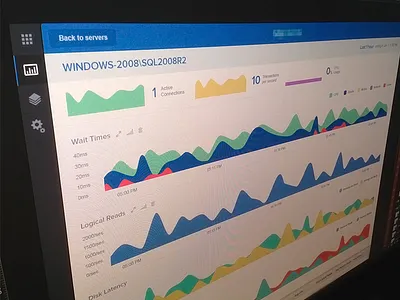
  20. Servers WIP analytics app buttons clean dashboard data menu overview people server servers webapp
    View Servers WIP
    Servers WIP
    737
    45.4k
  21. iOS Data Exploration data graph grid ios layout mockup report ui
    1
    View iOS Data Exploration
    iOS Data Exploration
    767
    49.3k
  22. Security Dashboard Exploration chart data graph grid ios layout mockup security ui
    View Security Dashboard Exploration
    Security Dashboard Exploration
    1k
    140k
  23. Stats Exploration analytics chart dashboard data graph product statistics stats ui
    View Stats Exploration
    Stats Exploration
    1.6k
    112k
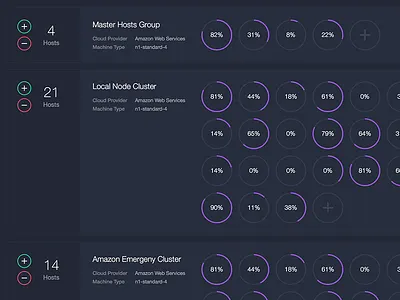
  24. Mesosphere Host Groups chart cluster counter dcos graphs hosts increment mesosphere nodes pie ring
    View Mesosphere Host Groups
    Mesosphere Host Groups
    65
    8.8k
Loading more…