Dribbble: the community for graphic design
Shots
Shots
Designers
Explore
Popular
New and Noteworthy
Product Design
Web Design
Animation
Branding
Illustration
Mobile
Typography
Print
Hire a Designer
Browse Designers
Submit a Project Brief
Post a Job
Hiring on Dribbble
Find Jobs
Blog
Sign up
Log in
Line Charts
Facebook icon
Share
Twitter icon
Tweet
Copy
6 Shots
•
6 Designers
Mark Johnson
Facebook icon
Share
Twitter icon
Tweet
Copy
Shot Link
View IBM Design | Microinteractions Pt. II
IBM Design | Microinteractions Pt. II
Like
IBM
Team
Like
659
74.9k
Shot Link
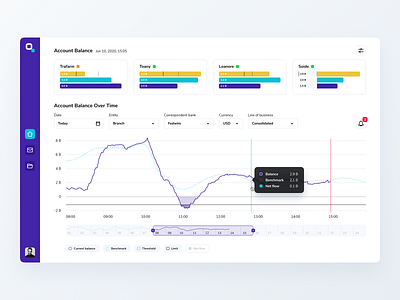
View Finance monitoring system
Finance monitoring system
Like
Vadym Kr
Pro
Like
36
12.2k
View Data Visualisation
Data Visualisation
Like
Naveen Reddy
Like
38
21.2k
1
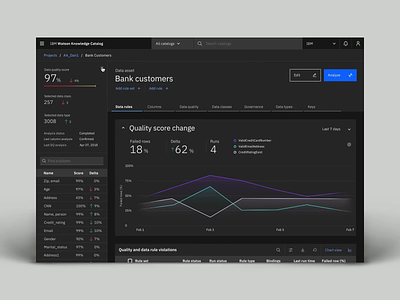
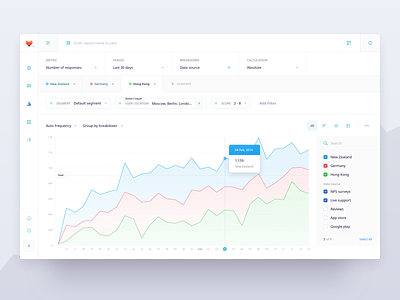
View Report Builder for NLP Platform
Report Builder for NLP Platform
Like
Gregory Muryn-Mukha
Pro
Like
909
303k
Shot Link
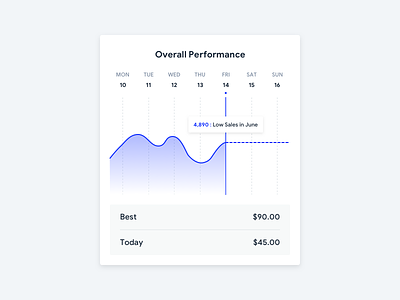
View Line Graph - Light Mode / Dark Mode
Line Graph - Light Mode / Dark Mode
Like
Jim Renaud
Like
57
18.6k
Shot Link
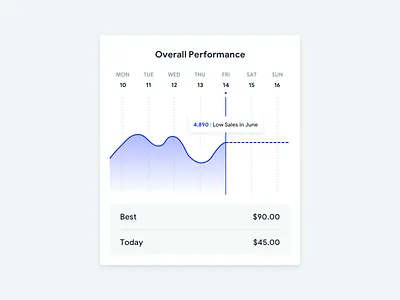
View Line Graph - based on Echart.js
Line Graph - based on Echart.js
Like
GeeTest
Team
Like
174
79.4k
Sign up to continue
Loading more…
Previous
Next
Loading…