Data Visualisation
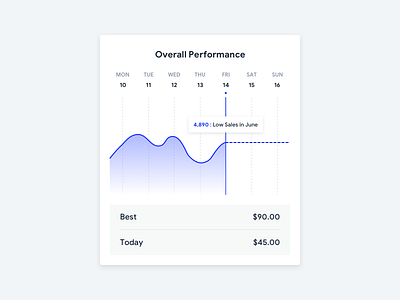
Charts show insights not just data. Provide information that can be consumed fast, with a minimum of cognitive processing. After doing more research you should be able to identify core information, work only with limited space to display it, especially on the mobile screen. Choosing the right graph for your content (line chart, Pie chart, bar chart, etc) is also critical.
