1. Affiliate Marketing Tool affiliate analytics chart clean dark dashboard finance fintech graph marketing overview payment platform profile reward statistics tool tracker transaction wallet
    View Affiliate Marketing Tool
    Affiliate Marketing Tool
    474
    178k
  2. Projack 👨🏻‍💻- Ease You to Monitor Your Work blue and white chart clean dashboard clean design clean ui dashboad line chart profit task manager uidesigns uiux
    View Projack 👨🏻‍💻- Ease You to Monitor Your Work
    Projack 👨🏻‍💻- Ease You to Monitor Your Work
    361
    84.6k
  3. Stacked Chart Close Up app charts dashboard saas ui
    View Stacked Chart Close Up
    Stacked Chart Close Up
    115
    12.1k
  4. IBM Design | Microinteractions Pt. II dashboard dashboard design dashboard ui ibm design interaction design interactive interface motion design motion graphics product design ui ui design web web design webdesign website
    View IBM Design | Microinteractions Pt. II
    IBM Design | Microinteractions Pt. II
    659
    74.9k
  5. IBM Design | Watson Studio | Part 1 ampersandrew animation charts dashboad dashboard design dashboard ui ibm design interactive interactive design interface motion design motion graphics product design table ui ui design web web design webdesign website
    View IBM Design | Watson Studio | Part 1
    IBM Design | Watson Studio | Part 1
    327
    95.3k
  6. Data Visualisation bar charts data visualisation graph information graphic line chart naveenparne pie charts ui ui ux ui ux design ux
    View Data Visualisation
    Data Visualisation
    38
    21.2k
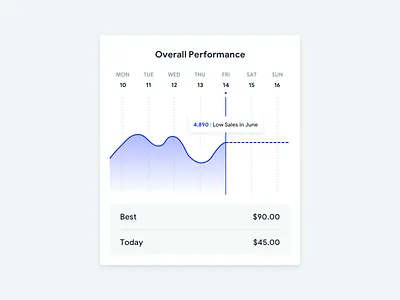
  7. Dashboard Perfomance bank bar chart dashboard finance fintech gauge graph illustration line perfomance social statistics stats ui ux
    View Dashboard Perfomance
    Dashboard Perfomance
    1.7k
    462k
  8. Workout Animation Framer animation app framer graph ios line sketch svg ui workout
    View Workout Animation Framer
    Workout Animation Framer
    33
    4k
  9. Map Graph Plotted Chart chart data data visualization graph grid interface line graph map plot plotted visualization
    View Map Graph Plotted Chart
    Map Graph Plotted Chart
    25
    11k
  10. Metrics Dashboard dashboard data graph line map metrics overview sparkline visualization
    View Metrics Dashboard
    Metrics Dashboard
    57
    11.8k
  11. Fitness App - Statistics app clean dark theme fitness line graph radar chart statistics ui ux workout tracker
    View Fitness App - Statistics
    Fitness App - Statistics
    82
    26.9k
  12. Data Visualization - Graph Library area chart chart dashboard data data visualization donut chart graph library line chart polar sparkline statistics
    View Data Visualization - Graph Library
    Data Visualization - Graph Library
    90
    22.6k
  13. Comparison chart application area chart chart dashboard data management data table data visualization desktop graph interface line chart ui
    View Comparison chart
    Comparison chart
    172
    68.3k
  14. Report Builder for NLP Platform analytics analytics chart area chart bar chart builder chart chart builder dashboard data visualisation enterprise graph legend line achart metrics report report builder report design score tabs web
    1
    View Report Builder for NLP Platform
    Report Builder for NLP Platform
    909
    303k
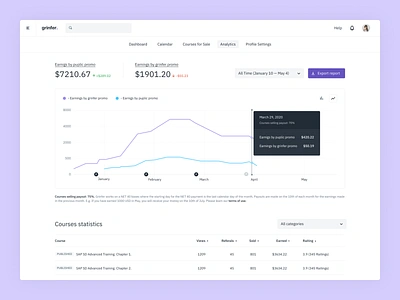
  15. grinfer - authors analytics page. analysis analytics analytics dashboard charts clean courses dashboard data visulization design elearning graph grinfer line chart platform tool ui ux web
    View grinfer - authors analytics page.
    grinfer - authors analytics page.
    611
    224k
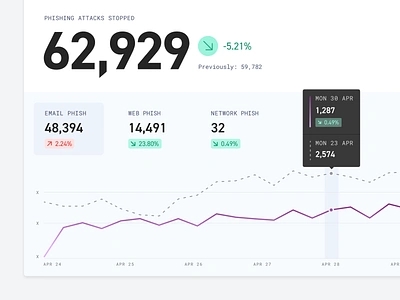
  16. 💥 Phishing Attacks analytics attacks chart clean component dashboard design line graph minimal phishing security simple typography ui ux
    View 💥 Phishing Attacks
    💥 Phishing Attacks
    237
    39.9k
  17. Charting charts graphs
    View Charting
    Charting
    13
    1.3k
  18. Ronin - charting view chart device finance fintech interface trading ui
    View Ronin - charting view
    Ronin - charting view
    27
    1.5k
  19. Stock Charting • Cryptocurrency Dashboard bitcoin blockchain chart clean coin crypto cryptocurrency dashboard exchange finance fintech interface marketplace platform stats stock trade ui ux web design
    View Stock Charting • Cryptocurrency Dashboard
    Stock Charting • Cryptocurrency Dashboard
    84
    15.8k
  20. Report builder dark theme analytics chart dark mode dark theme dark ui dashboad dashboard data data visualisation data visualization dataviz design editor enterprise glow interface neon report tabs widget
    View Report builder dark theme
    Report builder dark theme
    803
    328k
  21. Budget Saver Reports analytics banking chart clean dashboad finance graphic interface minimal product product design purple statistics stats ugem ui ux web web design
    View Budget Saver Reports
    Budget Saver Reports
    562
    105k
  22. Orion UI kit - Charts templates & infographics in Figma chart dark ui data vusialisation design orion product ui ui kit ux web
    View Orion UI kit - Charts templates & infographics in Figma
    Orion UI kit - Charts templates & infographics in Figma
    552
    133k
  23. Dark Money Management Budget & Finance Web App bank chart bank dashboard bank web dashboard design dark money management web app dark money management web app fin tech dashboard fin tech dashboard design finance web app income dashboard bank app investment web app investment web app money management budget money management budget my transaction history product design tool retirement policy webdesign
    View Dark Money Management Budget & Finance Web App
    Dark Money Management Budget & Finance Web App
    803
    206k
  24. Orion UI kit chart dark ui data vusialisation design orion product ui ui kit
    View Orion UI kit
    Orion UI kit
    483
    72.9k
Loading more…