1. Data Viz: Area Chart analytics area chart chart dashboard data data analysis data analytics datavisualisation datavisualization design editorial design graph illustration magazine statistic statistics stats typography visualisation visualization
    View Data Viz: Area Chart
    Data Viz: Area Chart
    47
    10.5k
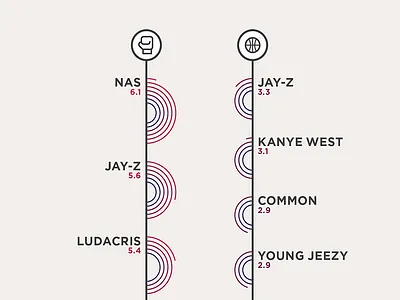
  2. Affinity chart circle flat graph icon info infographic music sports
    View Affinity
    Affinity
    54
    3.3k
  3. remotemyapp.com chart circle games gradient juicy :) remote stats
    View remotemyapp.com
    remotemyapp.com
    30
    2.3k
  4. Black and Gold Chart black black and gold bold chart chart design charts dark design gold theme ui
    View Black and Gold Chart
    Black and Gold Chart
    6
    1.1k
  5. Representative video 2d 3d chart circle energy evening glass isometric low poly pie polygon
    View Representative video
    Representative video
    27
    2.3k
  6. Pie chart blue chart graph illustration report ui ux web
    View Pie chart
    Pie chart
    98
    26.7k
  7. Revenue Forecast blue chart creative figure graph illustration numbers revenue simple stats ui vector web
    View Revenue Forecast
    Revenue Forecast
    35
    12.3k
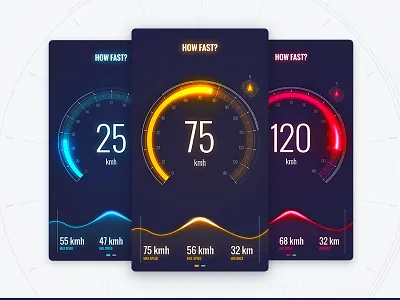
  8. Speedometer data glow graph how fast interface sketch speedometer ui user interface velocimeter
    View Speedometer
    Speedometer
    79
    8.7k
  9. Bubble Chart chart graph temperature visualization
    View Bubble Chart
    Bubble Chart
    13
    2.3k
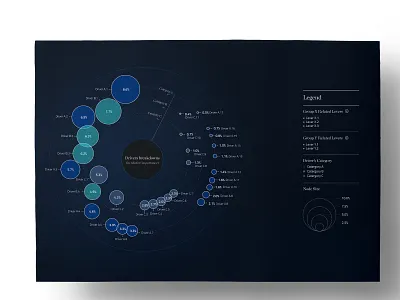
  10. Visualising the drivers of a model analysis bubble chart data data visualisation drivers visual storytelling
    View Visualising the drivers of a model
    Visualising the drivers of a model
    39
    7.3k
  11. Infographics for Dashboard UI alluvial diagram bubble chart chart charts dashboard data visulization data viz infographic radar chart radial tree sankey diagram sociogram tree map
    View Infographics for Dashboard UI
    Infographics for Dashboard UI
    213
    91.2k
  12. Cancer Diagnosis Chart bubble cancer chart color grid infographic map survivor vector
    View Cancer Diagnosis Chart
    Cancer Diagnosis Chart
    14
    2.8k
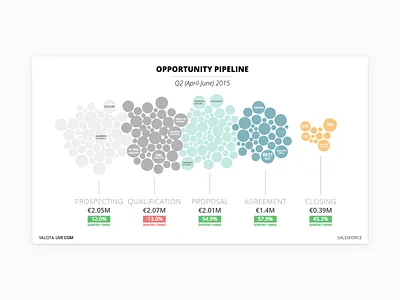
  13. Valota Salesforce b2b bubble chart d3 d3js data visualization digital signage enterprise salesforce signage visualization
    View Valota Salesforce
    Valota Salesforce
    15
    6.8k
  14. Bubble Chart analytics bubble charts data data visualization graph science statistics trend visualization
    View Bubble Chart
    Bubble Chart
    56
    11.1k
  15. Car Dashboard car dashboard photoshop ui
    View Car Dashboard
    Car Dashboard
    119
    12.7k
  16. Deals animation clean data data visualisation e commerce flinto line chart minimal timeline web web app web site
    View Deals
    Deals
    867
    104k
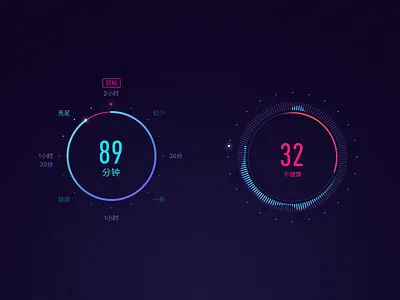
  17. Fitness Graph chart fitness graph health
    View Fitness Graph
    Fitness Graph
    91
    8.3k
  18. Animated Visual for Telecom Website Product Page animated visual animation art code css animation dark dashboard data visualization futuristic hypnotic interactive motion design orb space sphere spiral statistics ui ux web development zajno
    View Animated Visual for Telecom Website Product Page
    Animated Visual for Telecom Website Product Page
    608
    124k
  19. Line Chart chart dashboard data design finance fire game graph ios statistics stats ui
    1
    View Line Chart
    Line Chart
    2.3k
    234k
Loading more…