1. 2D Graph after effects analytics animated gif chart data gif gif animation graph infographic loop seamless loop statistics
    View 2D Graph
    2D Graph
    97
    13.1k
  2. Reminder clock icon time ui vector widget
    View Reminder
    Reminder
    406
    14.8k
  3. Red Sox Scores: May 10, 2016 baseball chart charts data data visualization data viz infographic sports
    View Red Sox Scores: May 10, 2016
    Red Sox Scores: May 10, 2016
    71
    4.2k
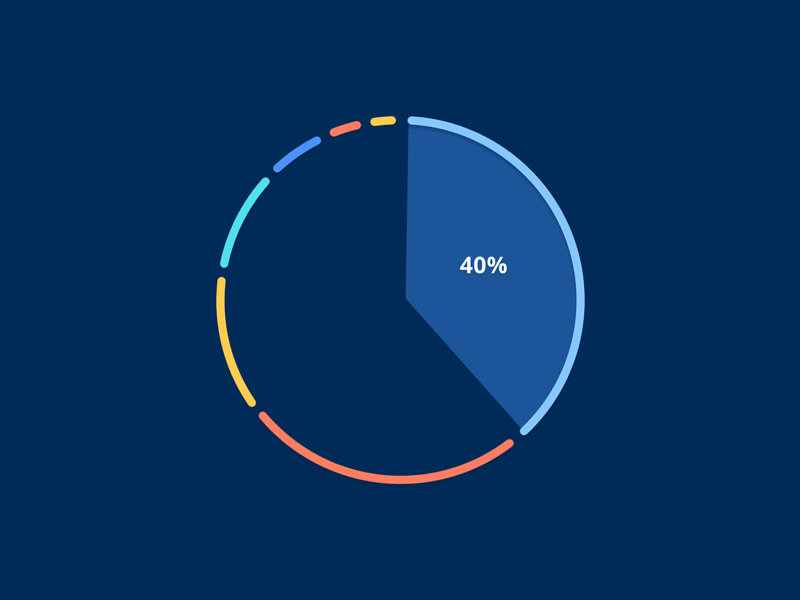
  4. Dashboard Visualizations: Pie Chart animation clean dashboard data dataviz gif minimal motion product reporting ui visualization
    View Dashboard Visualizations: Pie Chart
    Dashboard Visualizations: Pie Chart
    127
    20.2k
  5. The Expressions Express after effects animation expressions gif graph loop rig shape layers
    View The Expressions Express
    The Expressions Express
    129
    7k
  6. Pie Chart chart flat pie ui
    View Pie Chart
    Pie Chart
    22
    6.7k
  7. Funnel UI concept after effects animation color data design funnel gif motion purple ui ux visualisation
    View Funnel UI concept
    Funnel UI concept
    266
    21.2k
  8. (Smoothly) animated data visualization animation data data visualization isobar isobar pixels motion graphics ui animation ux
    View (Smoothly) animated data visualization
    (Smoothly) animated data visualization
    193
    12.3k
  9. Reactive graph after effects animation colour gif graph infographic loop motion screen ui
    View Reactive graph
    Reactive graph
    116
    8.9k
  10. Filter Animation animation data viz filter live
    View Filter Animation
    Filter Animation
    19
    2.1k
  11. 24hr Diet Coxcomb coxcomb
    View 24hr Diet Coxcomb
    24hr Diet Coxcomb
    0
    495
  12. List Chart app chart list ui
    View List Chart
    List Chart
    103
    5.6k
  13. Stacked Area Chart chart composition download graph joy division sketch stacked area chart
    View Stacked Area Chart
    Stacked Area Chart
    43
    4.6k
  14. Spoon.net Homepage Concept animation app ui ux web website
    View Spoon.net Homepage Concept
    Spoon.net Homepage Concept
    176
    19k
  15. IQM Visualization Interactions animation app design infographics interface ui ux web
    View IQM Visualization Interactions
    IQM Visualization Interactions
    846
    59.8k
  16. Dashboard audit boerzhijia chart dashboard data fai fpy oob html5 ios q stop ui web
    1
    View Dashboard
    Dashboard
    37
    2.9k
  17. Hot Spots design development hotspot illustration map sneak peak wdg web development group world
    View Hot Spots
    Hot Spots
    12
    2k
  18. Dashboard app calendar chart clean dashboard deal event flat icon ui web
    View Dashboard
    Dashboard
    142
    7k
  19. Power & wind visualization chart data forecast microsoft power bi turbines visualization web wind yellow
    View Power & wind visualization
    Power & wind visualization
    788
    56.3k
  20. Bubbles ae analytics animation chart data dataviz gif hover interface stats ui
    View Bubbles
    Bubbles
    1.1k
    73k
  21. 3 Spots Left 3 creating vector textures geometric google hangouts illustration number numeral three
    View 3 Spots Left
    3 Spots Left
    455
    17.3k
  22. Infotools Radials 3d clear info infographics infotools
    View Infotools Radials
    Infotools Radials
    270
    7.9k
  23. Noisemeter live ang animation graph infographics max min noise radial sanfrancisco sound
    View Noisemeter live
    Noisemeter live
    138
    10.7k
Loading more…