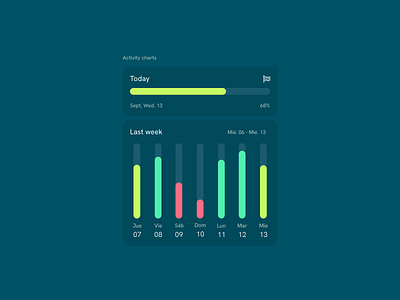
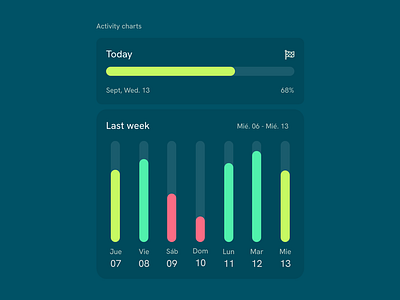
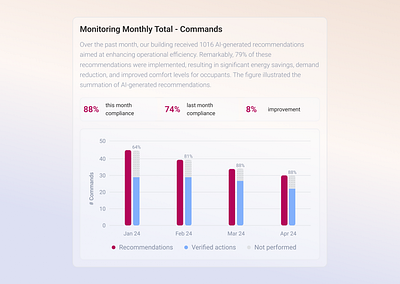
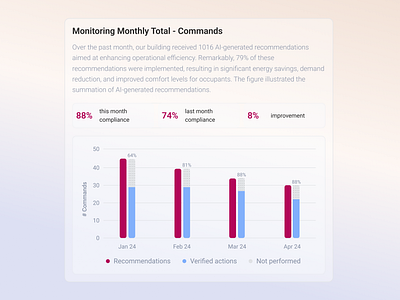
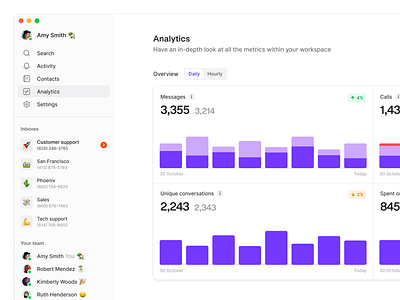
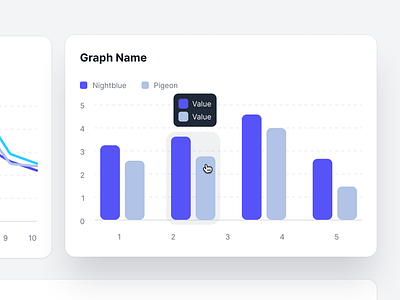
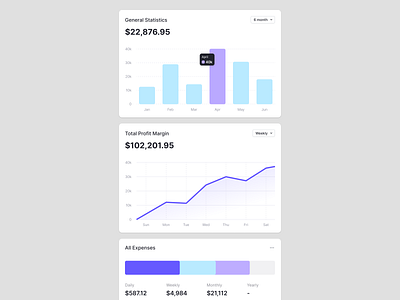
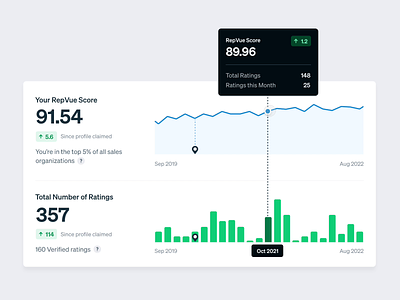
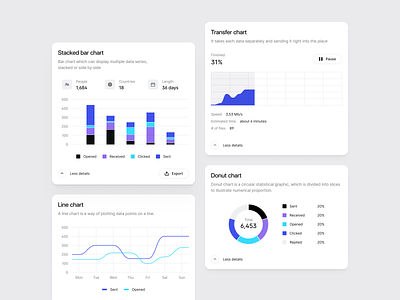
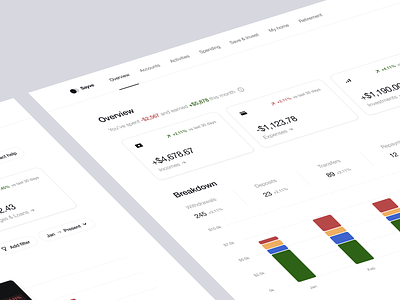
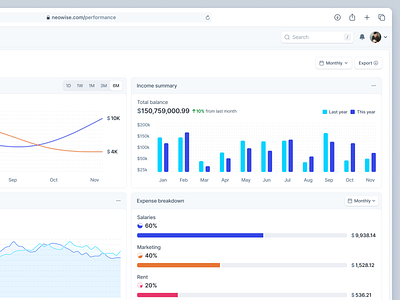
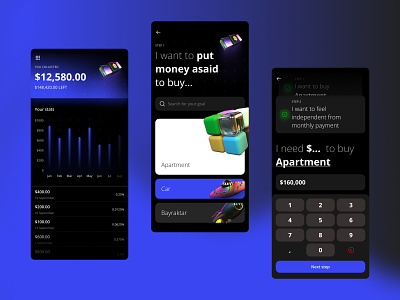
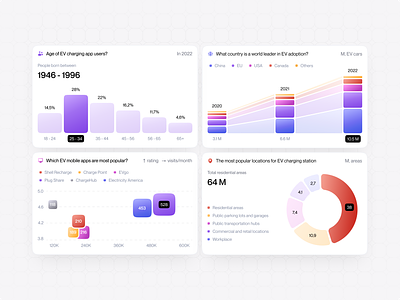
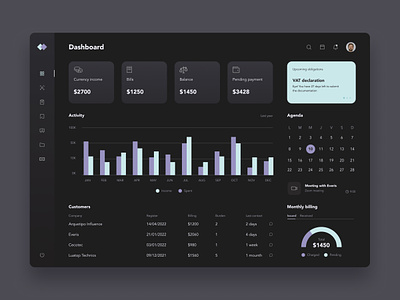
Bar Chart

1,281 inspirational designs, illustrations, and graphic elements from the world’s best designers.
Want more inspiration? Browse our search results...

  1. Activity charts bar chart charts component less minimmal design progress stats ui ui component user interface user interface design ux ux ui widget
    View Activity charts
    Activity charts
    8
    2.6k
  2. Environmental Charts Design | Bar Chart | Monitoring & Analytics appdesign bar chart charts complex information compliance dailyui data visualization environmental charts design improvement management metrics monitoring monthly total commands numbers statistics ui uidesign userexperience userinterface uxdesign
    View Environmental Charts Design | Bar Chart | Monitoring & Analytics
    Environmental Charts Design | Bar Chart | Monitoring & Analytics
    4
    1k
  3. Google Analytics Icon for Rule Communication 3d 3d icon analytics b3d bar bar chart blender c4d chart cinema 4d cycles gold google graph icon icon set illustration ios render round
    View Google Analytics Icon for Rule Communication
    Google Analytics Icon for Rule Communication
    172
    51.6k
  4. Dark Dashboard Exploration 02 🌑 animation assistance bar chart chart create creating custom dark dashboard flow help interface modal process ui user interface ux
    View Dark Dashboard Exploration 02 🌑
    Dark Dashboard Exploration 02 🌑
    776
    253k
  5. Chart Library - Free 90+ Charts UI KIT analytics area chart bar chart chart library crm data visualization donut chart dual axis chart figma free freebies graph line chart saas sales statistics ui ui kit ux waterfall chart
    1
    View Chart Library - Free 90+ Charts UI KIT
    Chart Library - Free 90+ Charts UI KIT
    240
    39.5k
  6. Sales dashboard — Untitled UI b2b bar chart bar graph charts clean ui crm dashboard graph nav navigation product design saas sidenav table ui ui design user interface ux ux design web app
    View Sales dashboard — Untitled UI
    Sales dashboard — Untitled UI
    340
    242k
  7. Analytics for OpenPhone app bar chart calls charts clean compare dashboard data desktop graphs messages minimal numbers phone saas stats table ui ux web
    View Analytics for OpenPhone
    Analytics for OpenPhone
    771
    461k
  8. Charts Component for Glide Pages bar chart blue clean ui data tip data visualisation hover line graph minimal redesign saas startup tooltip ui design
    View Charts Component for Glide Pages
    Charts Component for Glide Pages
    338
    145k
  9. Widget Exploration banking bar chart component design expanse finance financial fintech line chart management minimal money product design saas saas tool saving wallet web webapp widget
    View Widget Exploration
    Widget Exploration
    6
    3.5k
  10. Saas widgets analytics analytics dashboard bar chart chart chart widget dashboard dashboard widgets ecommerce figma line chart list pie chart saas saas widgets statistics statistics card transaction uikit widgets
    View Saas widgets
    Saas widgets
    26
    10.9k
  11. Chart Hoverstate animation bar chart bar graph chart compare data data visualization data viz graph hover hover interaction hoverstate insight product design ratings score tooltip trend trend over time ui
    View Chart Hoverstate
    Chart Hoverstate
    153
    28.7k
  12. Limiter 3d 3d animation animated animation bar chart blender blender3d button chart illustration interface isometric knob toggle volume
    View Limiter
    Limiter
    64
    18.8k
  13. Analytic dashboard app app app dashboard banking bar chart charts clean dashboard design fintech interface liner chart mobile app mobile banking mobile dashboard mobile fintech online banking ui ui design ux web app
    View Analytic dashboard app
    Analytic dashboard app
    320
    103k
  14. Chart Sticker Sheet area bar chart charts clean color coding design system donut graphs grid histogram kpi legend line lines pie sticker sheet tokens transfer ui ux
    View Chart Sticker Sheet
    Chart Sticker Sheet
    538
    148k
  15. Personal Finance App banking bar chart chart clean dashboard data design details display finance graph home interface metrics minimal money overview summary ui ux
    View Personal Finance App
    Personal Finance App
    368
    242k
  16. Neowise: Card Component Finance Tracking Web App SaaS Dashboard analytics bar bar chart card chart component dashboard finance financial graph graphic invoice money product design saas statistics stats summary table web app
    View Neowise: Card Component Finance Tracking Web App SaaS Dashboard
    Neowise: Card Component Finance Tracking Web App SaaS Dashboard
    123
    17.9k
  17. Save money app 3d app bar chart chart dark dark ui financial fintech keyboard money save money ui
    View Save money app
    Save money app
    68
    26.1k
  18. Interviews and data | Charts and graphs | Analysis data bar chart bubble chart cards charts column chart comparison chart dashboard data doughnut gradient graph icons infographic interwiev numbers pie chart rating scatter chart stacked bar chart users
    1
    View Interviews and data | Charts and graphs | Analysis data
    Interviews and data | Charts and graphs | Analysis data
    377
    61k
  19. Supermetrics pencil bar graph 3d animation bar chart bra graph motion graphics pencils
    View Supermetrics pencil bar graph
    Supermetrics pencil bar graph
    50
    19.7k
  20. Dashboard exploration - dark version backoffice bar chart calendar card chart dark dashboard dashboard dark data visualization datatable dataviz design list semicircle chart table ui ux web
    View Dashboard exploration - dark version
    Dashboard exploration - dark version
    150
    100k
  21. Performanza - Sales Analytics Dashboard admin panel analytics analytics dashboard bar chart finance dashboard funnel chart heatmap report dashboard saas sales sales analytics sales dashboard sales funnel sales management sales monitoring sales report sales tracking statistic store analytics sunburst chart
    View Performanza - Sales Analytics Dashboard
    Performanza - Sales Analytics Dashboard
    123
    23.6k
  22. BLOG - Dynamic Business Through Analytics analytics bar chart blocks blog blog cover blog header building chart charts city data digital illustration editorial illustration line chart skyscraper social vizlib
    View BLOG - Dynamic Business Through Analytics
    BLOG - Dynamic Business Through Analytics
    9
    1.9k
  23. Radial Chart activity analytics bar chart card charts dashboard data finance fintech fitness health mobile app radial chart statistics stats tile ui ux web app
    View Radial Chart
    Radial Chart
    868
    387k
  24. Chart bar command menu ai apollo bar chart chart chart ai chart customization chart size chart type chart ui chatgpt command menu crm customisation dashboard funnel line chart open ai pie chart saas salesforce
    View Chart bar command menu
    Chart bar command menu
    22
    20.3k
Loading more…