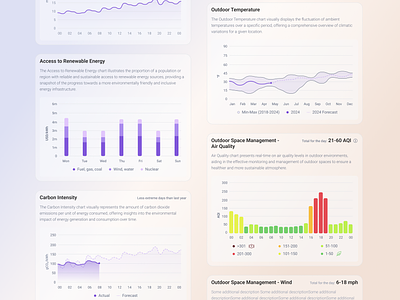
Environmental Charts Design | Bar Chart | Monitoring & Analytics
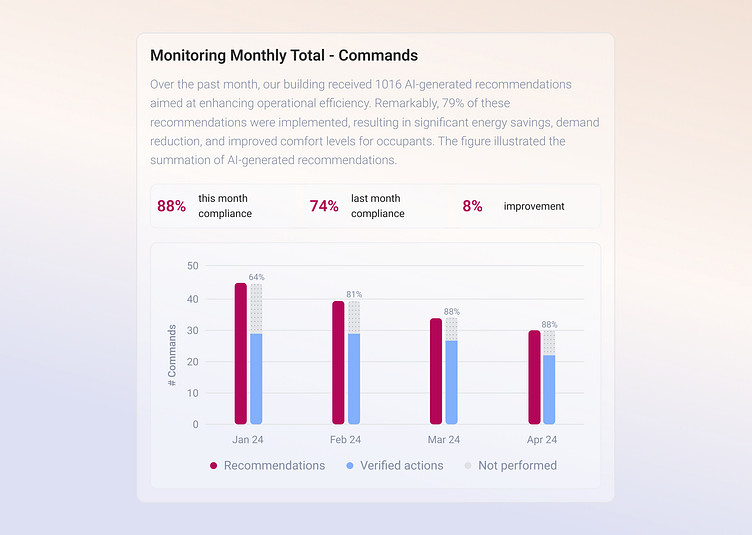
Visualize monthly environmental data effortlessly with our sleek bar chart design, simplifying complex information for easy monitoring of total commands.
What do you think? Don’t hesitate to comment 😊
Have a project in mind? Contact us 📧
Follow us 📲