Environmental Charts Design | Line chart | Bar Chart
Hello 👋
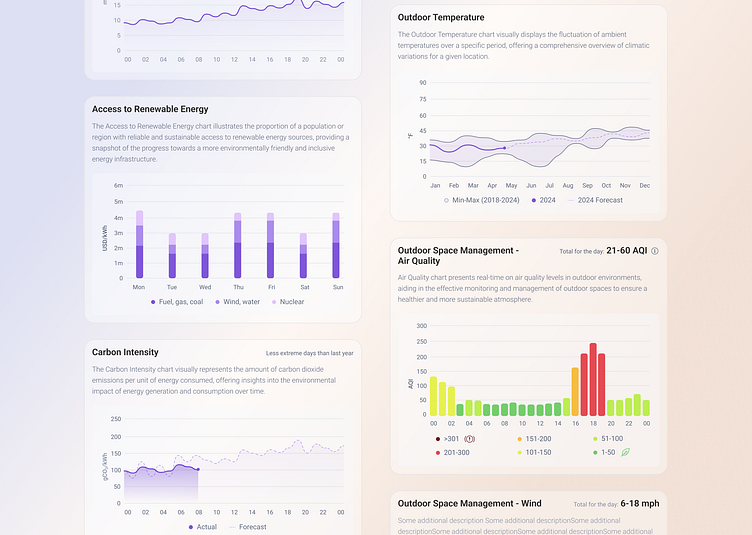
Explore the harmony of form and function with this Dribbble shot showcasing a sleek Environmental Charts Design. Dive into data visualization as line and bar charts seamlessly integrate with a sophisticated dashboard and table, offering a visually engaging experience for tracking environmental metrics. Transform raw data into actionable insights with this modern and intuitive design.
What do you think? Don’t hesitate to comment 😊
Have a project in mind? Contact us 📧
Follow us 📲