Find designers
Designer search
Quickly find your next designer
Post a job
The #1 job board for design talent
Inspiration
Jobs
Go Pro
Log in
Dribbble: the community for graphic design
Log in
Sign up
HubOne
Facebook icon
Share
Twitter icon
Tweet
Copy
8 Shots
•
7 Designers
Alexia Simard
Facebook icon
Share
Twitter icon
Tweet
Copy
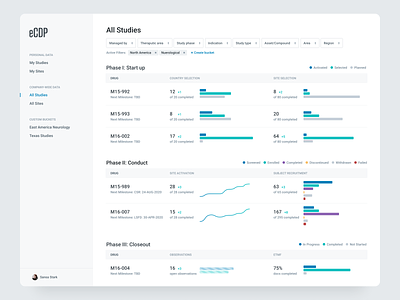
View Medical Studies Concept
Medical Studies Concept
Like
Piper Lawson
Like
551
229k
Shot Link
View Sharing Analytics - Transition effect
Sharing Analytics - Transition effect
Like
Gregory Muryn-Mukha
Pro
Like
1.3k
336k
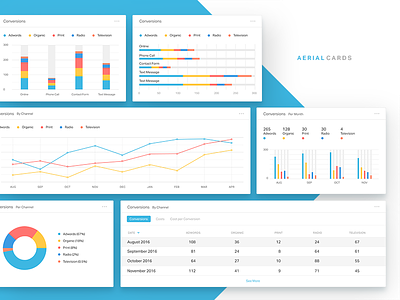
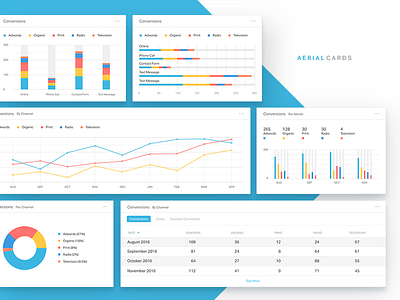
View Aerial Cards
Aerial Cards
Like
Moe Amaya
Like
50
5.7k
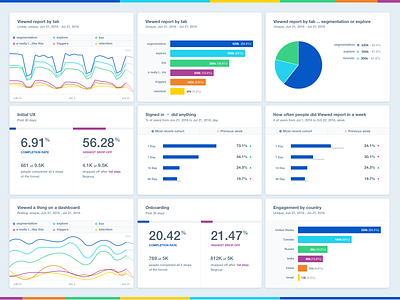
View New Reports Color
New Reports Color
Like
Mixpanel
Team
Like
191
18.4k
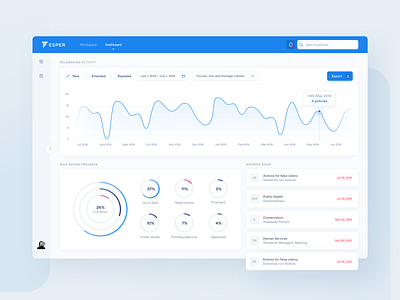
View Esper – dashboard
Esper – dashboard
Like
Netguru
Team
Like
441
123k
3
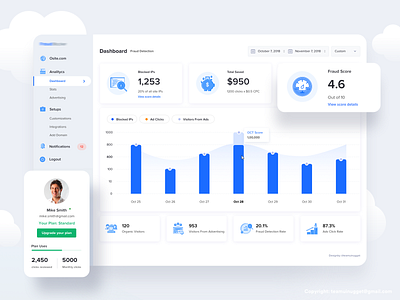
View #1 Protect advertisers from paying for fraudulent clicks
#1 Protect advertisers from paying for fraudulent clicks
Like
Ofspace
Team
Like
792
128k
Shot Link
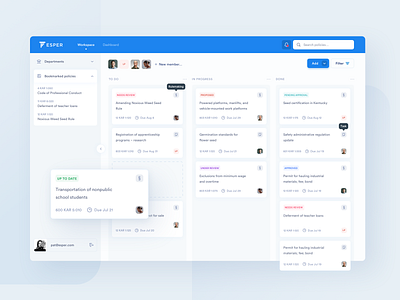
View Esper – a modern framework for public policy
Esper – a modern framework for public policy
Like
Netguru
Team
Like
1.1k
193k
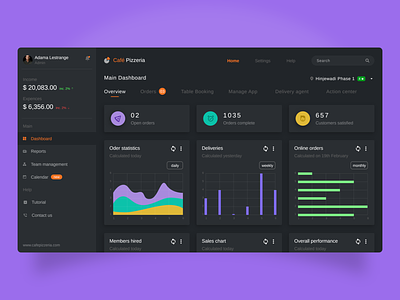
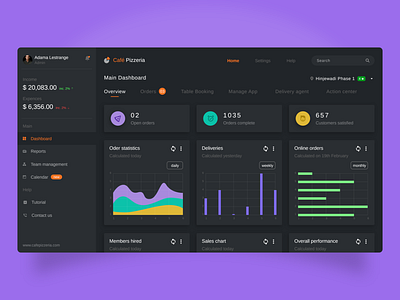
View Cafe Dashboard
Cafe Dashboard
Like
Rishi
Like
29
3.8k
Sign up to continue
Loading more…
Previous
Next
Loading…