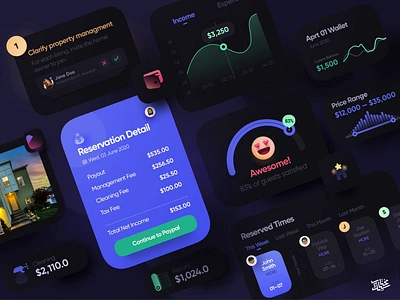
1. Dashboard Perfomance bank bar chart dashboard finance fintech gauge graph illustration line perfomance social statistics stats ui ux
    View Dashboard Perfomance
    Dashboard Perfomance
    1.7k
    462k
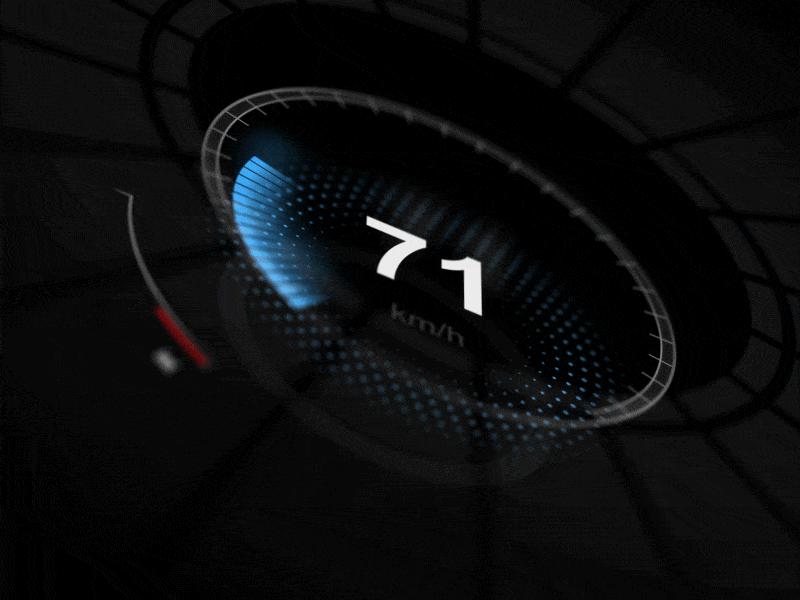
  2. Speedometer Gauge Motion Design Concept aftereffects auto automotive automotive design car cluster concept design dial digital gauge hmi interface motion design speed speedometer vehicle
    View Speedometer Gauge Motion Design Concept
    Speedometer Gauge Motion Design Concept
    229
    122k
  3. Smart Home App app chart dashboard energy gauge graph home house indicator ios real estate remote rent statistics stats tablet temperature ui ux web
    5
    View Smart Home App
    Smart Home App
    6k
    1m
  4. Speedometer Concept (Motion Design, Sound ON) acceleration automobile automotive automotive design automotive dial car cluster dial digital driving gauge instrument interface motion motion design speed ui ui ux uiux vehicle
    View Speedometer Concept (Motion Design, Sound ON)
    Speedometer Concept (Motion Design, Sound ON)
    412
    191k
  5. Attio – Reporting Gauge visualization Exploration attio cards clean crm dark dashboard gauge graphs information design light reporting reports speedometer visualisation
    View Attio – Reporting Gauge visualization Exploration
    Attio – Reporting Gauge visualization Exploration
    198
    31.9k
  6. Dashboard concept aftereffects analytics crm dashboad data desktop gauge graph platform portal profile report saas sales speedometer startup statistic stats video visualization
    View Dashboard concept
    Dashboard concept
    523
    264k
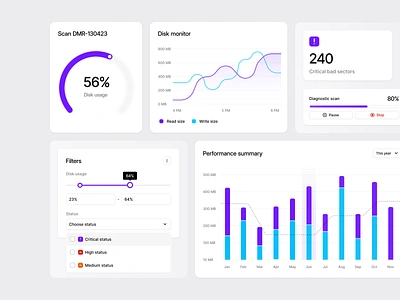
  7. Data cards & filters barchart cards charts dark data filters gauge gradients light linechart minimal product ui ux widgets
    View Data cards & filters
    Data cards & filters
    391
    159k
  8. Speedometer Gauge Concept 3d after effects automotive automotive design car cinema4d cluster concept dial digital hmi interface realistic speed speedometer vehicle
    View Speedometer Gauge Concept
    Speedometer Gauge Concept
    127
    109k
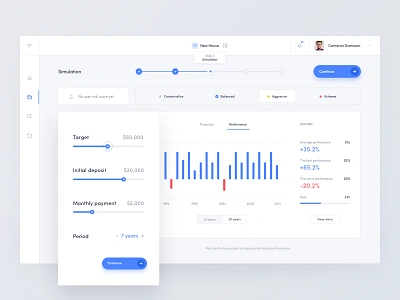
  9. Robo Advisor - Simulation - Web App chart dashboard finance financial gauge graph map pie chart robo advisor statistics stats
    View Robo Advisor - Simulation - Web App
    Robo Advisor - Simulation - Web App
    1.7k
    203k
  10. Robo Advisor - Projection bar chart dashboard finance financial gauge graph icons onboarding progress bar statistics stats steps
    View Robo Advisor - Projection
    Robo Advisor - Projection
    3.5k
    457k
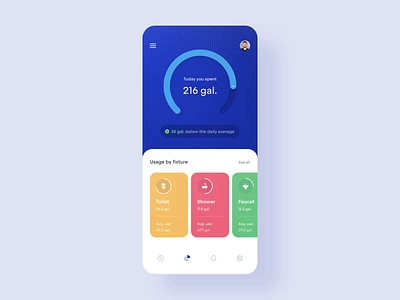
  11. Smart Home Water Monitoring 💧 analytics app application blue cards chart dashboard gauge graph house interface ios mobile product statistics stats timeline ui ux widelab
    View Smart Home Water Monitoring 💧
    Smart Home Water Monitoring 💧
    704
    457k
  12. Elegant UI kit - Dashboard curve dashboard download funnel gauge graph stats ui kit
    View Elegant UI kit - Dashboard
    Elegant UI kit - Dashboard
    1.1k
    107k
  13. Robo Advisor - Onboarding chart dashboard finance financial gauge graph icons map onboarding pie chart statistics stats
    View Robo Advisor - Onboarding
    Robo Advisor - Onboarding
    1.4k
    180k
  14. Robo Advisor - Web App chart dashboard finance financial gauge graph map pie chart robo advisor statistics stats
    View Robo Advisor - Web App
    Robo Advisor - Web App
    1.2k
    149k
  15. Bank Dashboard Design bank chart bank dashboard bank web app bank web application design bank web dashboard design dashboard design dashboard ui expense dashboard fin tech dashboard design fintech gauge graph fintech gauge graph map income dashboard bank app my cards my transaction history product design statics statistics ui ux web design
    1
    View Bank Dashboard Design
    Bank Dashboard Design
    1.3k
    359k
  16. Dark Dashboard User Interface app cards dark dashboard gauge graph list metrics navigation sidebar table ui webapp
    View Dark Dashboard User Interface
    Dark Dashboard User Interface
    229
    144k
  17. Average page load time - infographic header car design flat formula gauge illustration race racecar road speed stroke vector website
    View Average page load time - infographic header
    Average page load time - infographic header
    379
    176k
  18. Dark Mode • Real Estate app cards chart dashboard design gauge graph home house indicator ios real estate remote rent statistics stats tablet ui ux web
    View Dark Mode • Real Estate
    Dark Mode • Real Estate
    736
    222k
  19. Cryptocurrency bank chart cryptocurrency dashboard finance financial fintech gauge graph map statistics stats
    View Cryptocurrency
    Cryptocurrency
    624
    69.7k
  20. SmartHome App app chart energy gauge graph home house indicator ios mobile remote statistics
    View SmartHome App
    SmartHome App
    2.2k
    152k
  21. Robo Advisor - Projection, List and Questionnaire bank chart cryptocurrency dashboard finance financial fintech gauge graph map statistics stats
    View Robo Advisor - Projection, List and Questionnaire
    Robo Advisor - Projection, List and Questionnaire
    2.5k
    285k
  22. Robo Advisor Web App bank chart cryptocurrency dashboard finance financial fintech gauge graph map statistics stats
    View Robo Advisor Web App
    Robo Advisor Web App
    5.2k
    482k
  23. Gauge Icon animated css dashboard gauge icon levels meter web design
    View Gauge Icon
    Gauge Icon
    65
    33k
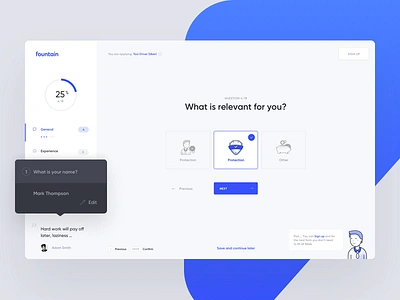
  24. Fountain - Applicant Form dashboard form gauge graph hr icons recruitment survey wizard
    3
    View Fountain - Applicant Form
    Fountain - Applicant Form
    4k
    569k
Loading more…