-
18432.7k
-
621193k
-
755.9k
-
1.5k541k
-
380130k
-
8416.2k
-
28275.5k
-
16378.6k
-
412141k
-
236.1k


Loading more…
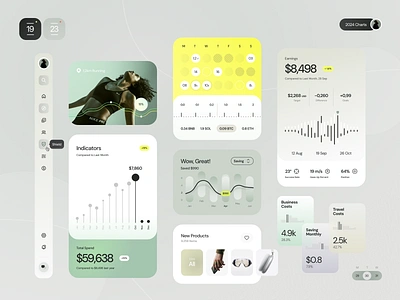
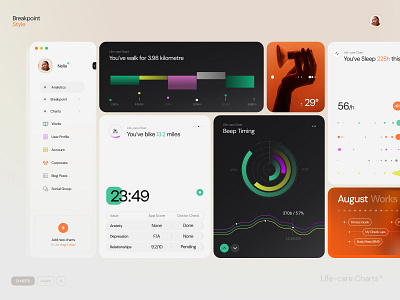
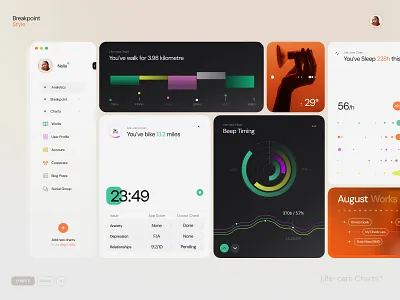
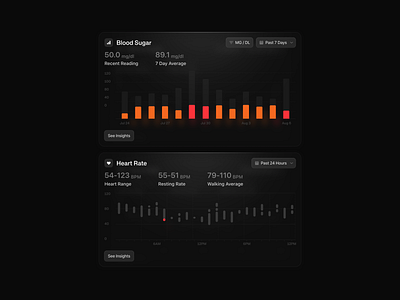
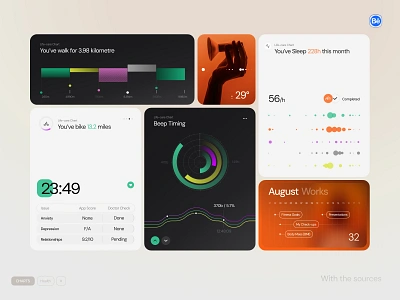
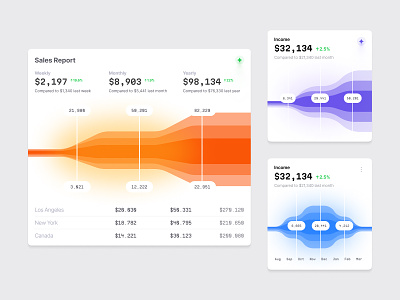
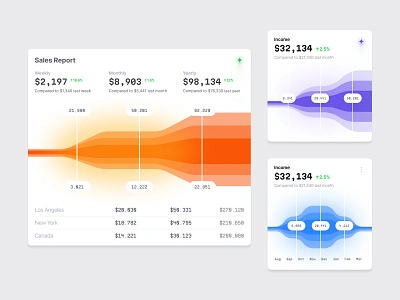
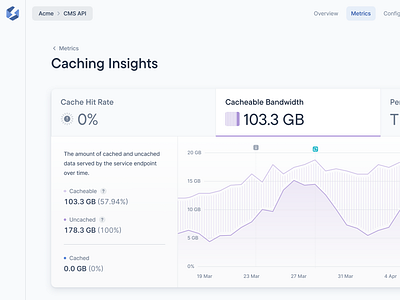
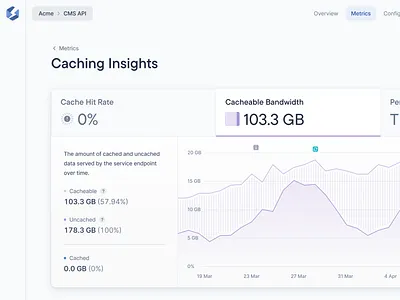
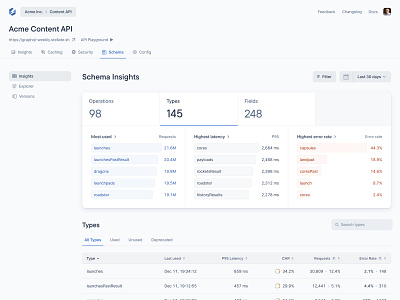
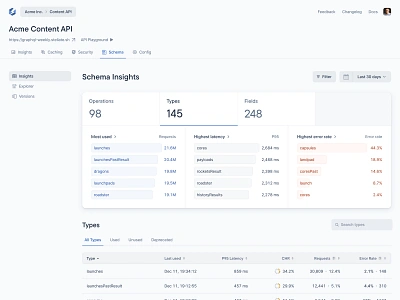
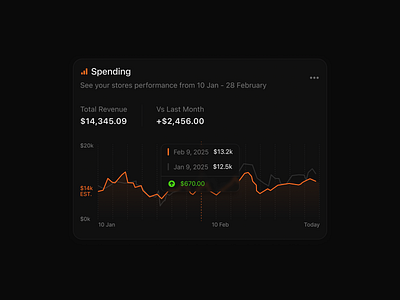
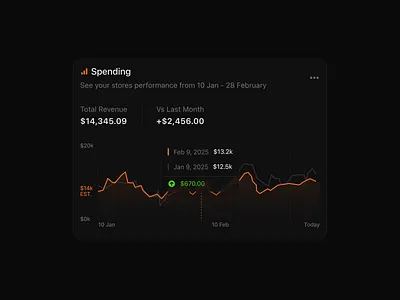
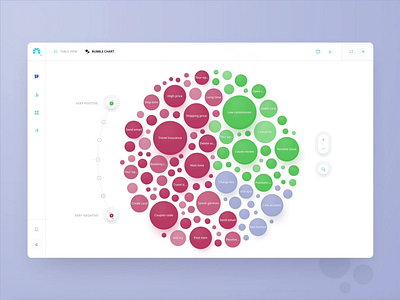
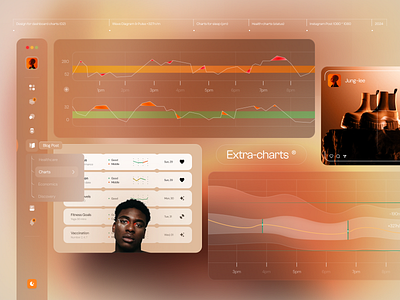
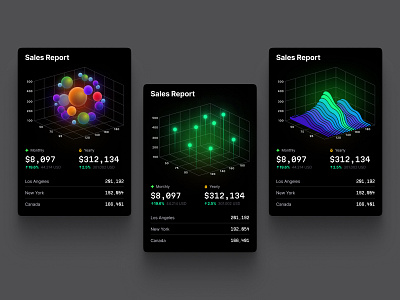
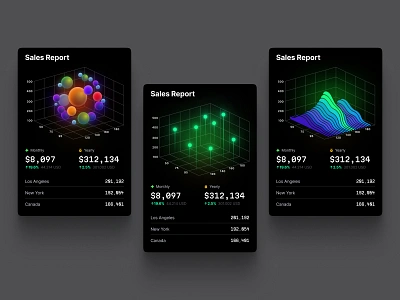
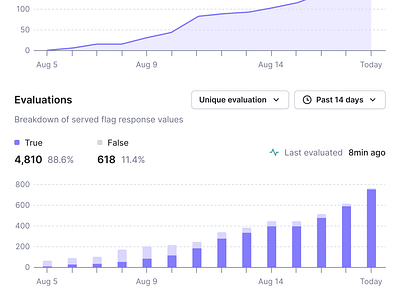
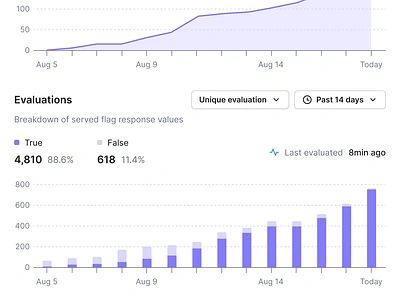
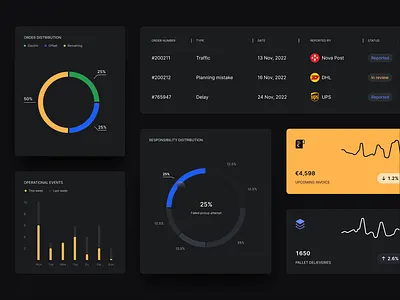
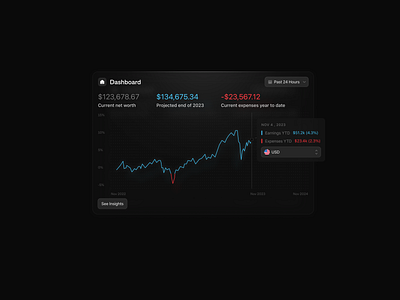
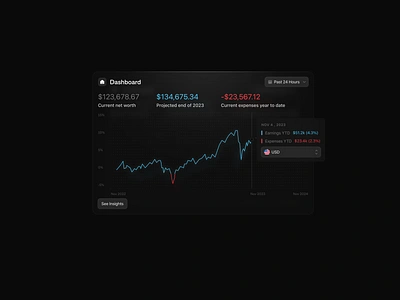
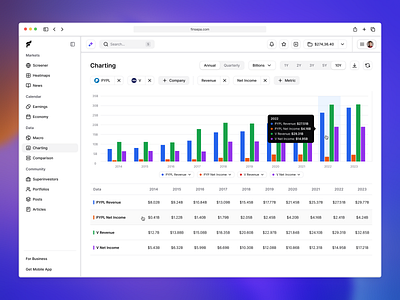
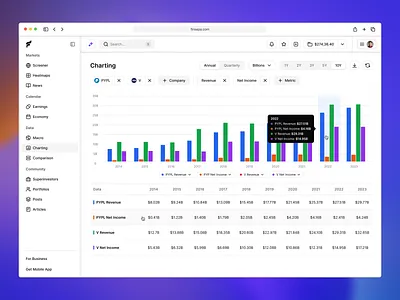
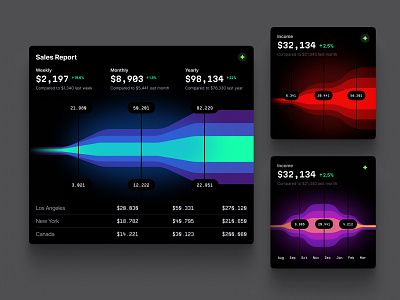
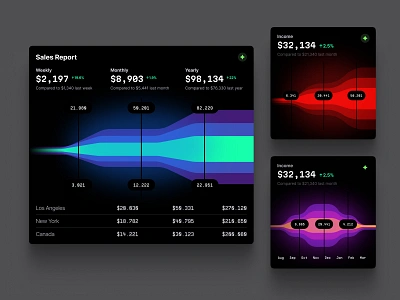
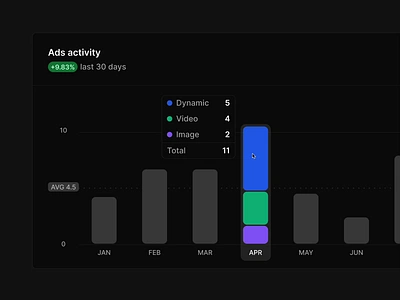
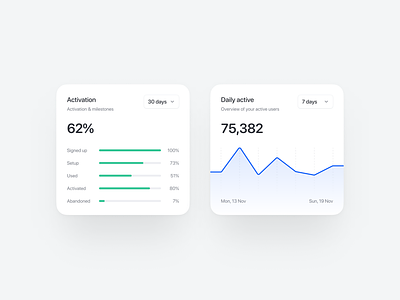
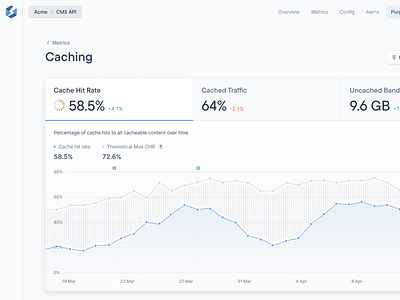
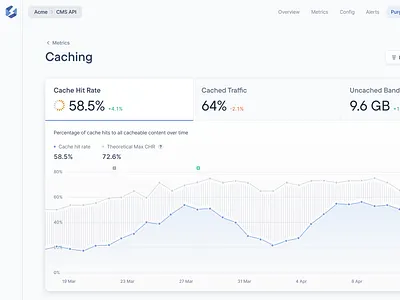
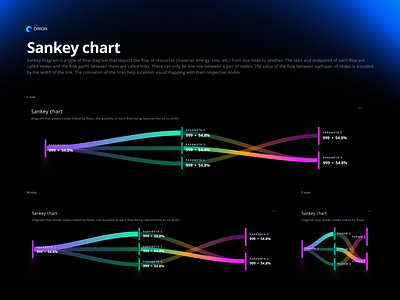
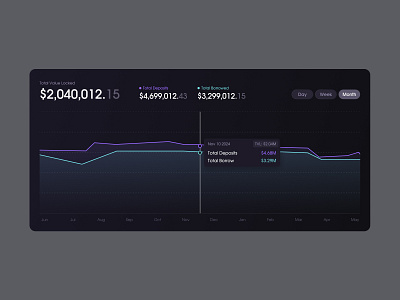
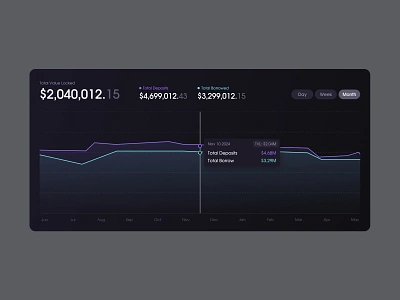
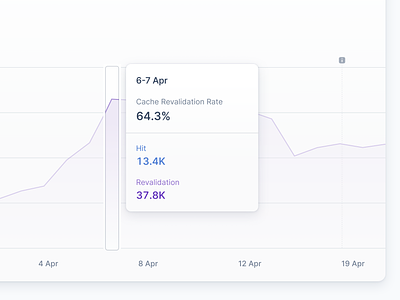
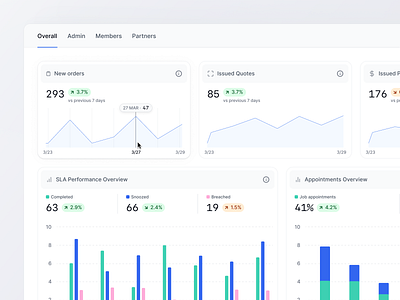
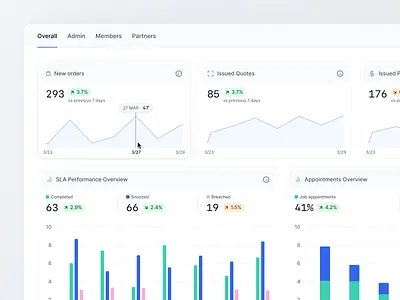
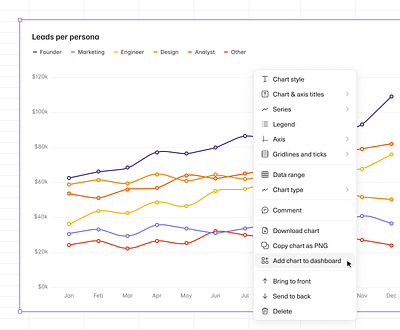
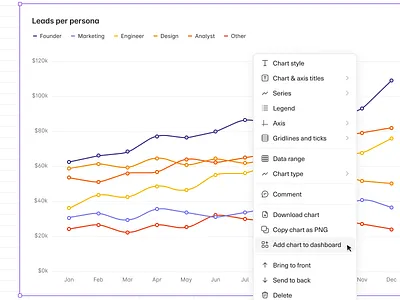
Inspirational chart designs, illustrations, and graphic elements


