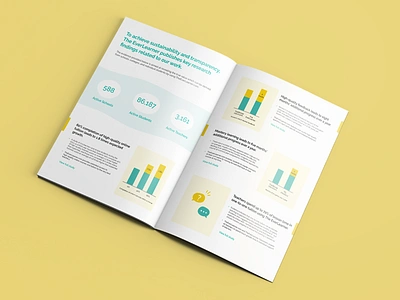
1. The EverLearner Booklet book booklet design graph graphic learning magazine school
    View The EverLearner Booklet
    The EverLearner Booklet
    30
    3.9k
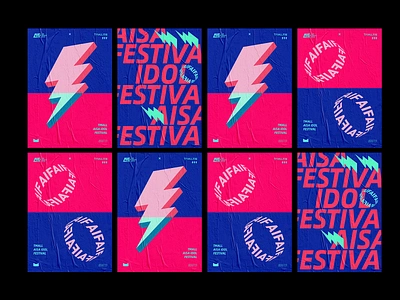
  2. Tmall Aisa Idol Festival Graph Design aisa art branding circle color design festival flashlight graph poster tmall visual identity
    View Tmall Aisa Idol Festival Graph Design
    Tmall Aisa Idol Festival Graph Design
    17
    2.3k
  3. BoardMaps application icon finance graph ios iphone leather notebook pencil photoshop plan prototype sketch sketch book sticker
    View BoardMaps
    BoardMaps
    983
    47.6k
  4. Animated Icon Series: Portfolio animated book c4d chart document finance flat graph icon letter loop motion
    View Animated Icon Series: Portfolio
    Animated Icon Series: Portfolio
    35
    6.4k
  5. Audiobook Dashboard analytics art audiobook book chart dashboard data desktop ebook graph music player product product design reading reading app ui uiux user experience user interface
    View Audiobook Dashboard
    Audiobook Dashboard
    103
    14.9k
  6. Pop-Up Annual Report for Charity Water 3d annual report book charity water charity: water design graph paper paper art paper craft papercut pop up print
    View Pop-Up Annual Report for Charity Water
    Pop-Up Annual Report for Charity Water
    122
    11.8k
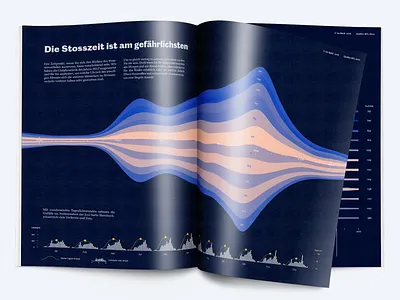
  7. Data Viz: Streamgraph accident analytics chart data data analysis data analytics data visualisation data visualization data viz datavis datavisualisation datavisualization dataviz graph magazine magazine design plot statistics streamgraph traffic
    View Data Viz: Streamgraph
    Data Viz: Streamgraph
    30
    9.7k
  8. The Coffee of Guatemala Infographic coffee color design graph guatemala infographic poster
    View The Coffee of Guatemala Infographic
    The Coffee of Guatemala Infographic
    15
    2.1k
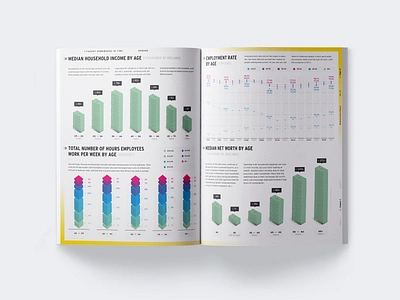
  9. Media Economy Report Vol. 14. data data visualization dataviz editorial graph illustration infographic infographics information design magazine money
    View Media Economy Report Vol. 14.
    Media Economy Report Vol. 14.
    260
    302k
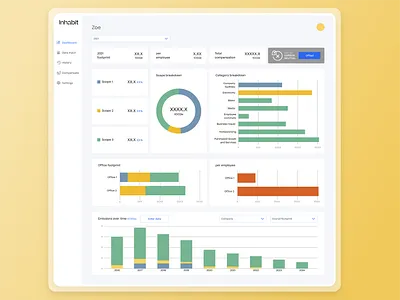
  10. Inhabit | Platform v3 agile branding dashboard data visualisation desktop development environment environmental graph graphic design layout layout design product product design sprint sustainability ui user experience user interface ux
    View Inhabit | Platform v3
    Inhabit | Platform v3
    7
    1.1k
  11. 2017 End-of-Year-ish Report agency annual annual report candy graph infographic infographics information design information graphic information graphics mm monotone netflix poster report statistics teal tequila timberlake watch
    View 2017 End-of-Year-ish Report
    2017 End-of-Year-ish Report
    51
    30.5k
  12. Industries v2 book data design graph industrial map print report story
    View Industries v2
    Industries v2
    15
    1.7k
  13. Donut Chart analytics analytics chart chart charts dash dashboard donut donut chart donut charts graph infographic pie pie chart pie charts print stats
    View Donut Chart
    Donut Chart
    83
    15.6k
  14. Leaves 5 poster
    View Leaves 5
    Leaves 5
    49
    1.1k
  15. Magazine graph infographic magazine
    View Magazine graph
    Magazine graph
    10
    855
  16. Notebook Stationery Line 2023 calendar chart cooking graph paper graphs guide guides industrial journal journals measurements notebook notebooks paper paper line scientific stationery stationery line vintage
    View Notebook Stationery Line
    Notebook Stationery Line
    44
    11.4k
  17. Poster - Graph blankposter.com graph helvetica lines poster
    View Poster - Graph
    Poster - Graph
    16
    625
  18. Apothecary Botanicals Booklet Spread adobe illustration adobe illustrator catalog catalog design catalogue design communication communication design graph icon icon artwork info graphic infographic infographics layout layout design layoutdesign print statistics stats vector
    View Apothecary Botanicals Booklet Spread
    Apothecary Botanicals Booklet Spread
    7
    1.6k
  19. NBA Infographic - Stephen Curry basketball chart curry graph infographic nba poster print sports stats
    View NBA Infographic - Stephen Curry
    NBA Infographic - Stephen Curry
    144
    7.3k
  20. Info Graph (2nd draft) alignment design graph graphic graphic design grid list numbers print red typography
    View Info Graph (2nd draft)
    Info Graph (2nd draft)
    53
    4.5k
  21. Data Exploration bar chart charts data donut chart editorial graphs illustration line graph numbers pie chart print report
    View Data Exploration
    Data Exploration
    29
    8.1k
  22. Stream analytics app bar charts clear data event graph minimalist simple stamp stream time timeline ui ux visualization web
    View Stream
    Stream
    159
    16.8k
  23. Data web site analytic app blockchain book buttons chart code computer data graph icons input landing notebook register form registration security ui ux web
    View Data web site
    Data web site
    977
    311k
  24. Offf Line Graph barcelona blue bold chart infographic line line graph offf orange poster print yellow
    View Offf Line Graph
    Offf Line Graph
    17
    1.8k
Loading more…