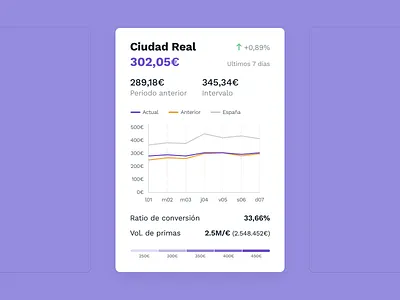
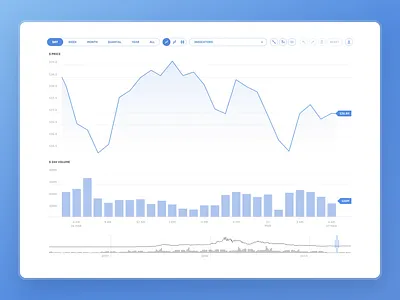
1. Line graph chart. dailyui dailyuichallenge design ui ux
    View Line graph chart.
    Line graph chart.
    1
    10.3k
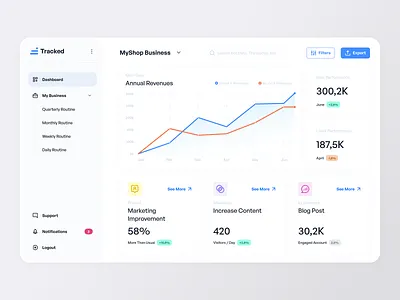
  2. User Insights Dashboard app design bar chart creative solutions dashboard data charts design design inspiration graphs guides illustration insight insights line chart line graph web app web application world world map
    View User Insights Dashboard
    User Insights Dashboard
    9
    5.6k
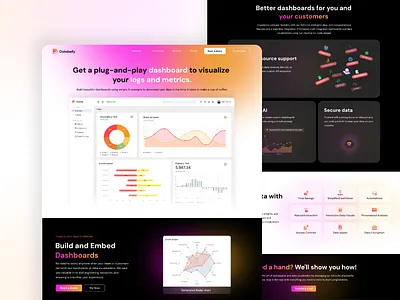
  3. Line Graph Chart UI design graphic design graphicdesigns ui ui design ux ui web design
    View Line Graph Chart UI
    Line Graph Chart UI
    3
    8.9k
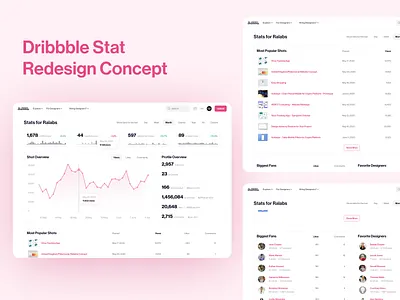
  4. Histogram bar chart charts dark theme histogram kpi light theme line chart retail transactions ui
    View Histogram
    Histogram
    6
    2.4k
  5. Line Graph analytics dailyui dashboard graph line graph
    View Line Graph
    Line Graph
    2
    6.8k
  6. Analytic Chart #18 analytic chart charts colorful dailyui design fig figma filter line chart ui
    View Analytic Chart #18
    Analytic Chart #18
    3
    4.1k
  7. Line Chart - Data Visualisation analytics bar chart chart dashboard data data visualisation data visualization figma graph line chart widgets
    View Line Chart - Data Visualisation
    Line Chart - Data Visualisation
    49
    11.3k
  8. HopeUI Analytics Overview admin dashboard admin dashboard design admin dashboard template admin template dashboard dashboard design design designer developer hopeui hopeui pro responsive social media dashboard ui uidesign uiux ux design web designer web developer website design
    View HopeUI Analytics Overview
    HopeUI Analytics Overview
    10
    3.3k
  9. Line Graph 123done analytics chart clean component dashboard data visualisation data visualization data viz dataviz figma graph infographic line line graph minimalism table teamplate ui universal data visualization
    View Line Graph
    Line Graph
    63
    15.9k
  10. Web analytics dashboard — Untitled UI analytics chart dashboard google analytics line chart line graph nav navigation product design sidenav ui ui design user interface web analytics
    View Web analytics dashboard — Untitled UI
    Web analytics dashboard — Untitled UI
    142
    26.5k
  11. Line Chart #Daily UI Challenge #17 chart dailyui line linechart linegraph ui
    View Line Chart #Daily UI Challenge #17
    Line Chart #Daily UI Challenge #17
    0
    671
  12. Light and Dark accounting accounting app bank accounts banking bonds charts clean dark mode financial app fintech investment app linechart minimal mobile app numbers piechart stock market stocks transaction history transactions
    View Light and Dark
    Light and Dark
    197
    86.1k
  13. Mini Line — Anearmala anearmalastudio ant design chart chart chart documentation data visualization design system figma mini line product design ui design ux design
    View Mini Line — Anearmala
    Mini Line — Anearmala
    1
    3.3k
  14. Data Viz on Product Design best of design design awards product design red dot red dot design award ui ux
    View Data Viz on Product Design
    Data Viz on Product Design
    229
    76k
  15. Updated the Line Chart Component in Figma branding design design system figma interface ui ui kit ux
    View Updated the Line Chart Component in Figma
    Updated the Line Chart Component in Figma
    13
    2k
  16. Chart Hoverstate animation bar chart bar graph chart compare data data visualization data viz graph hover hover interaction hoverstate insight product design ratings score tooltip trend trend over time ui
    View Chart Hoverstate
    Chart Hoverstate
    156
    29.8k
  17. Dashboard component - Analytics platform analytics components darkmode darkmodedesign dashboard data figma linechart product design reports ui uiux web web platform
    View Dashboard component - Analytics platform
    Dashboard component - Analytics platform
    2
    3.1k
  18. Statsy - Website analytics bento charts components gradients homepage linechart performance statistics statsy tools ui website
    View Statsy - Website
    Statsy - Website
    13
    3.5k
  19. Data Visualisation Exploration auto layout bar chart chart dashboard data visualisation digital figma insight line chart x matrix
    View Data Visualisation Exploration
    Data Visualisation Exploration
    5
    7.1k
  20. Neowise: Performance - Company Financial Tracking Web App SaaS admin analytic bar chart chart dashboard finance financial graph indicator line chart money percentage performance pie chart product design saas statistic table tracking web app
    View Neowise: Performance - Company Financial Tracking Web App SaaS
    Neowise: Performance - Company Financial Tracking Web App SaaS
    150
    16.7k
  21. Unify Viz - 300+ Premium Figma and React Charts areachart barchart charts cybersecurity dashboard dataviz design funnelchart graphic design sankey ui ux
    1
    View Unify Viz - 300+ Premium Figma and React Charts
    Unify Viz - 300+ Premium Figma and React Charts
    7
    11.6k
  22. Daily UI - 017 dailyui graph ui line graph mobile graphs mobile ui
    View Daily UI - 017
    Daily UI - 017
    9
    6.4k
  23. Admin Dashboard admin animation chart dashboard linechart motion graphics piechart ui
    View Admin Dashboard
    Admin Dashboard
    7
    5.5k
  24. Unrealistically nice curves chart charts dashboard finance financial tool graph linechart statistics trend
    View Unrealistically nice curves
    Unrealistically nice curves
    1
    1.8k
Loading more…