1. PlusImpact - Online Report bank charts corporate data design equality interaction interactive interface report startup ui web website
    View PlusImpact - Online Report
    PlusImpact - Online Report
    347
    144k
  2. Analytics Dashboard analytics calendar chart clean dashboard date selector graph line graph serif ui ux web
    View Analytics Dashboard
    Analytics Dashboard
    139
    56.5k
  3. 💨 GA Dashboard analytics chart dashboard debut design google graph illustration statistics ui
    1
    View 💨 GA Dashboard
    💨 GA Dashboard
    697
    48.9k
  4. Google Analytics concept - Home screen data fintech graph interface lawtech minimal profile stats
    View Google Analytics concept - Home screen
    Google Analytics concept - Home screen
    146
    53.8k
  5. Drilldown Page analytics application application design applications dashboard dashboard design data visualization graph statistics stats user interface web webdesign website
    View Drilldown Page
    Drilldown Page
    44
    11.4k
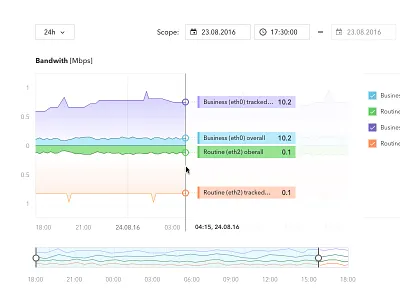
  6. Bandwith Graph dashboard graph line graph slider statistic time range
    View Bandwith Graph
    Bandwith Graph
    45
    11.1k
  7. Table chart dashboard graph statistic table trend
    View Table
    Table
    26
    5.3k
  8. Map Popover graph map network popover security status time series
    View Map Popover
    Map Popover
    29
    4.1k
  9. Network Security Monitoring Dashboard dashboard graph map network security statistic web widget
    View Network Security Monitoring Dashboard
    Network Security Monitoring Dashboard
    41
    4.7k
  10. Analytics analytics charts dashboard graph statistic stats timeseries
    View Analytics
    Analytics
    33
    2.3k
  11. Analytics, Time chart dashboard data graph map ui ux
    View Analytics, Time
    Analytics, Time
    28
    1.6k
  12. Surveillance dashboard exploration bar chart dark dark mode dashboard data graph location map night surveillance visualization
    View Surveillance dashboard exploration
    Surveillance dashboard exploration
    19
    2.8k
  13. Street View Analysis analytics chart component crashes data graph intersection map motion numetric play road street view
    View Street View Analysis
    Street View Analysis
    37
    12.8k
  14. Robo Advisor - Projection, List and Questionnaire bank chart cryptocurrency dashboard finance financial fintech gauge graph map statistics stats
    View Robo Advisor - Projection, List and Questionnaire
    Robo Advisor - Projection, List and Questionnaire
    2.5k
    285k
  15. BoxedCMS - Business Overview admin business chart clean cms control panel dashboard gallery graph map photos profile reviews stats ui ux
    View BoxedCMS - Business Overview
    BoxedCMS - Business Overview
    807
    169k
Loading more…