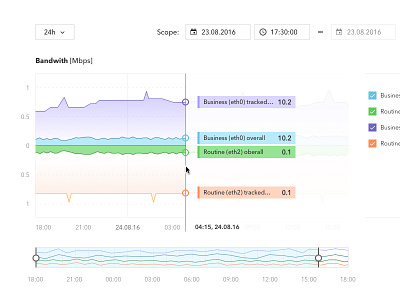
Bandwith Graph
This is a re-design concept for a timeseries plot, in this particular case to monitor bandwith usage over time.
The time navigator beneath the graph adapts to the time range presets and always shows the absolute width of that intervall. The scope, which is highlighted blue, allows zooming further in time and influences the view in the graph.
Check also the attachement for full view and other states.
More by Ivo Baldi View profile
Like

