1. Nutrition Tracking • Chart Interaction animation app bar chart chart dashboard data design graph health interface motion nutrition product tracking trend ui visual visualization web
    View Nutrition Tracking • Chart Interaction
    Nutrition Tracking • Chart Interaction
    644
    209k
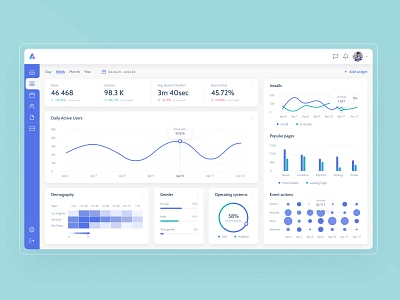
  2. Analytic dashboard concept analytics app bubble chart chart dashboard dashboard template dashboard ui design desktop diagram ecommerce graph heatmap metrics statistics stats tablet ui ux web
    View Analytic dashboard concept
    Analytic dashboard concept
    860
    289k
  3. Scatter chart variation analytics analytics dashboard app chart clean diagram scatter simple simplicity ui
    View Scatter chart variation
    Scatter chart variation
    31
    8k
  4. Figma infographics. Matrix distribution. Scatter chart bubble chart charts dashboard data analysis data analytics data design figma figma kit figma templates infographics material design charts presentation design scatter templates ui kit
    View Figma infographics. Matrix distribution. Scatter chart
    Figma infographics. Matrix distribution. Scatter chart
    66
    22.3k
  5. Charts dashboard application chart dashboard donut flat graph pie scatter statistics tooltip
    View Charts dashboard
    Charts dashboard
    134
    14.6k
  6. Bubble Chart bubble chart chart comparison download fitness graph scatter chart sketch
    View Bubble Chart
    Bubble Chart
    154
    24.2k
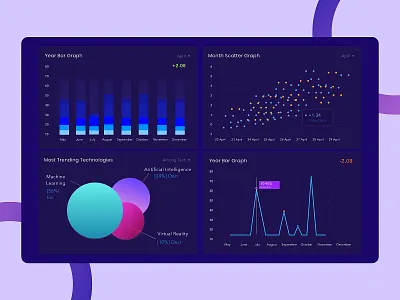
  7. Data Visualization Dashboard analytics bar graph blue blue shades color theory dashboard dashboard design data database datavisualization deep learning element line graph machine learning purple scatter graph user experience design user interface yellow
    View Data Visualization Dashboard
    Data Visualization Dashboard
    43
    18.9k
  8. Sankey Diagram analysis analytics artificial intelligence behavioral data big data bright chart data data visulization datagran dataviz diagram google analytics saas web traffic
    View Sankey Diagram
    Sankey Diagram
    13
    4.8k
  9. Nobels, no degree chart circle data data visualization datavis graph infographic information sankey visualization
    View Nobels, no degree
    Nobels, no degree
    126
    10.7k
  10. Update Back Office of Magic Scenario chart data design diagram graphical user interface info graphic info graphics infographic infographic design infographics sankey visualization
    View Update Back Office of Magic Scenario
    Update Back Office of Magic Scenario
    76
    21k
  11. Back Office of Magic Scenario data design info graphic sankey visualization
    View Back Office of Magic Scenario
    Back Office of Magic Scenario
    45
    11.8k
  12. Product Dashboard dashboad data visualization diagram interface map product sankey ui ux
    View Product Dashboard
    Product Dashboard
    42
    12.1k
  13. Visual Data Pack from thePenTool asset chart charts data visulization data viz design asset design resource funnel horizon pie chart premium sankey scatter thepentool tiles treemap
    View Visual Data Pack from thePenTool
    Visual Data Pack from thePenTool
    61
    32.5k
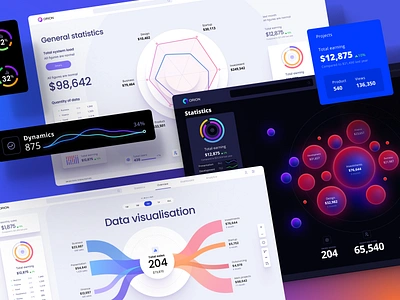
  14. A huge set of templates for visualizing your data on dashboards analytic app design circle chart components dashboard dataviz design library dynamic graphic infographic mobile mobile app prediction progress sankey template trend ui uiux widgets
    View A huge set of templates for visualizing your data on dashboards
    A huge set of templates for visualizing your data on dashboards
    119
    94.3k
  15. Sankey Digram chart color data data vis data visulisation diagram flat flow flow chart infographic sankey statistics
    View Sankey Digram
    Sankey Digram
    136
    49k
  16. UI kit for dashboard and presentations ai analytics chart components data visualization database datascience desktop figma informers machine learning presentatiom saas saas app sankey chart statistic template ui widgets
    View UI kit for dashboard and presentations
    UI kit for dashboard and presentations
    224
    142k
  17. Sales Pipeline Sankey analytics chart dark dashboard graph sankey visualization
    View Sales Pipeline Sankey
    Sales Pipeline Sankey
    289
    95.8k
Loading more…