Sankey Diagram
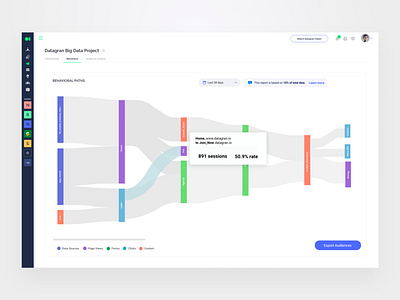
After two interactions, research and user testing the Product team decide to go with a more familiar visualization for users and complement it with different charts that help understand different points in the data.
After two interactions, research and user testing the Product team decide to go with a more familiar visualization for users and complement it with different charts that help understand different points in the data.
