1. 2019 2019 annual black blue brand branding clean design illustration liferay modern report typography ui
    View 2019
    2019
    92
    36k
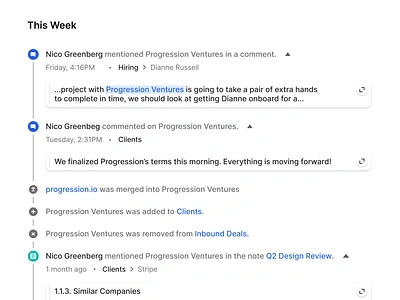
  2. Activity Feed collaboration comments crm feed notes product software timeline tool ui ux web app
    View Activity Feed
    Activity Feed
    682
    288k
  3. Spotify Design Team Website brand brand design brand identity branding color design icons illustration spotify ui ux web webpage website website design
    View Spotify Design Team Website
    Spotify Design Team Website
    68
    15.2k
  4. Blog covers abstract branding cover data editorial engineering geometrical shapes illustration
    View Blog covers
    Blog covers
    211
    49.7k
  5. Collibra Illustrations branding data design rebrand vector
    View Collibra Illustrations
    Collibra Illustrations
    1.8k
    210k
  6. Where Did the Money Go? campaign finance charts data data vis elections finance money politics
    View Where Did the Money Go?
    Where Did the Money Go?
    20
    3.3k
  7. IBM Data Vis Guidelines bee data vis design ibm patrick lowden red shape viz
    View IBM Data Vis Guidelines
    IBM Data Vis Guidelines
    666
    39.6k
  8. Shell App ai barcode car disel driver fuel gas ios scan shell ukraine
    View Shell App
    Shell App
    747
    72.4k
  9. Data visualization infographic isometric design. 3d analisis data diagram graph growth information isometric isometric art isometric design isometric icons isometric illustration isometric style isometry pie chart report statistic chart visualization
    1
    View Data visualization infographic isometric design.
    Data visualization infographic isometric design.
    585
    156k
  10. Project management tool: Task board app canban dashboard data design interface product design taskboard tool ui ux web
    View Project management tool: Task board
    Project management tool: Task board
    349
    45.5k
  11. Project management tool: Projects app dashboad data desktop filters interface product design project management tool table tool
    1
    View Project management tool: Projects
    Project management tool: Projects
    439
    97.7k
  12. Project management tool: Projects. Card view app cards dashboard data desktop filters grid interface product design project management tool sidebar sort tool ui web
    6
    View Project management tool: Projects. Card view
    Project management tool: Projects. Card view
    1.4k
    305k
  13. Project management tool: Dashboard analytics app cards chart clean dashboad data diagram graph interface product design project management tool sidebar menu table ui ux web
    1
    View Project management tool: Dashboard
    Project management tool: Dashboard
    371
    142k
  14. Story Cover - Sketch Tricks Charts blog chart charts circle graph cover dashboard donut chart graph sketch sketch app tutorial ui
    View Story Cover - Sketch Tricks Charts
    Story Cover - Sketch Tricks Charts
    27
    10k
  15. Management System dashboards management table tasks work
    View Management System
    Management System
    146
    26.6k
  16. Product dashboard - Prototype analytics charts dark dashboard data flat graphs minimal open sans statistics ui widgets
    View Product dashboard - Prototype
    Product dashboard - Prototype
    106
    7.7k
  17. User Flow Diagram for Apple Watch App apple diagram flow iwatch message minimal process scheme ui ux watch wireframe
    View User Flow Diagram for Apple Watch App
    User Flow Diagram for Apple Watch App
    546
    42.3k
  18. Calendar, date range picker booking calendar css date date picker date range dates html picker range responsive ui ux
    View Calendar, date range picker
    Calendar, date range picker
    1.3k
    128k
  19. Data visualization / Statistics / Trends Design / graph / graphs analytics animation mixpanel motion statistics stats
    View Data visualization / Statistics / Trends Design / graph / graphs
    Data visualization / Statistics / Trends Design / graph / graphs
    1.6k
    125k
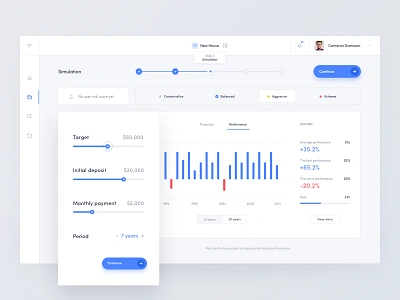
  20. Robo Advisor - Projection bar chart dashboard finance financial gauge graph icons onboarding progress bar statistics stats steps
    View Robo Advisor - Projection
    Robo Advisor - Projection
    3.5k
    458k
  21. Delivery Dashboard clean minimal nashatwork ui ui kit ux web
    1
    View Delivery Dashboard
    Delivery Dashboard
    385
    20.8k
  22. Stats Exploration analytics chart dashboard data graph product statistics stats ui
    View Stats Exploration
    Stats Exploration
    1.6k
    112k
  23. Mixpanel Navigation Menu Icons/UI analytics bookmark icons mixpanel navigation settings trend
    View Mixpanel Navigation Menu Icons/UI
    Mixpanel Navigation Menu Icons/UI
    1.3k
    98.5k
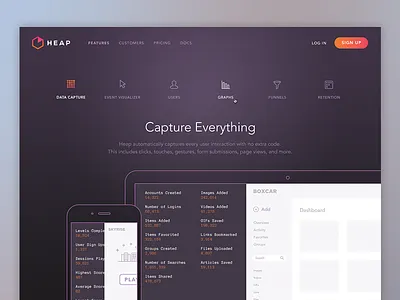
  24. Heap Analytics Features analytics branding features focus lab marketing ui web design website
    View Heap Analytics Features
    Heap Analytics Features
    1.8k
    112k
Loading more…