Find designers
Designer search
Quickly find your next designer
Post a job
The #1 job board for design talent
Inspiration
Jobs
Go Pro
Log in
Dribbble: the community for graphic design
Log in
Sign up
App
Facebook icon
Share
Twitter icon
Tweet
Copy
150 Shots
•
114 Designers
Andy Denham
Facebook icon
Share
Twitter icon
Tweet
Copy
1
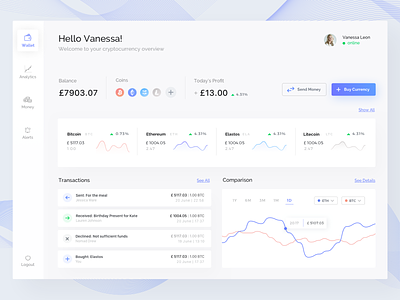
View Numise Dashboard
Numise Dashboard
Like
10Clouds
Team
Like
784
75.2k
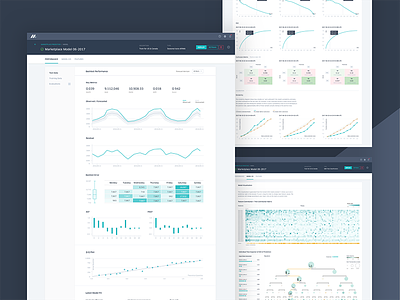
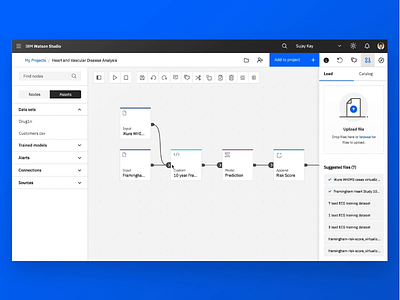
View Michelangelo: Uber’s Machine Learning Platform
Michelangelo: Uber’s Machine Learning Platform
Like
Uber
Team
Like
487
66.7k
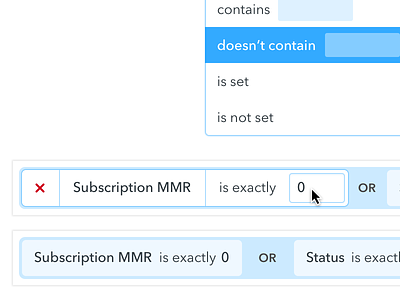
View Filter Builder
Filter Builder
Like
GoSquared
Team
Like
75
11.9k
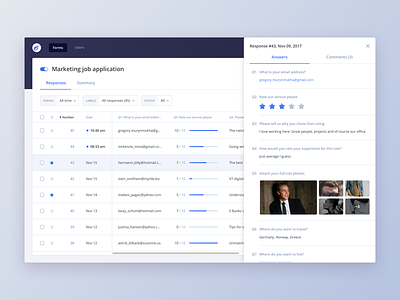
View Form builder - Survey results
Form builder - Survey results
Like
Gregory Muryn-Mukha
Pro
Like
1.2k
350k
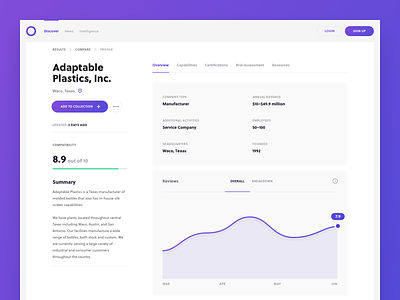
View Procurement Dashboard | Supplier Profile
Procurement Dashboard | Supplier Profile
Like
handsome
Team
Like
843
152k
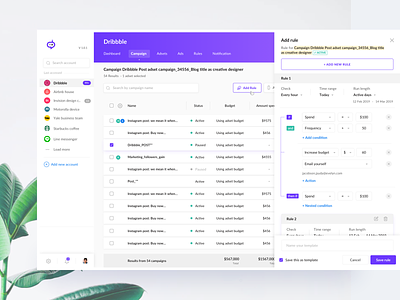
View Ad manager
Ad manager
Like
Divan Raj
Pro
Like
1.2k
277k
Shot Link
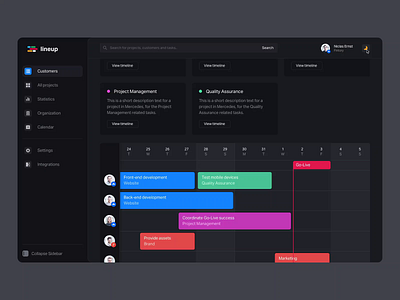
View Timeline & Management Tool - Dark Mode Interaction
Timeline & Management Tool - Dark Mode Interaction
Like
Fintory
Team
Like
2k
401k
Shot Link
View Colors in Watson IoT Design PAL
Colors in Watson IoT Design PAL
Like
IBM
Team
Like
187
30.4k
Shot Link
View Toolbelt
Toolbelt
Like
IBM
Team
Like
297
41.4k
Shot Link
View Monocle Reimagined
Monocle Reimagined
Like
IBM
Team
Like
528
62.1k
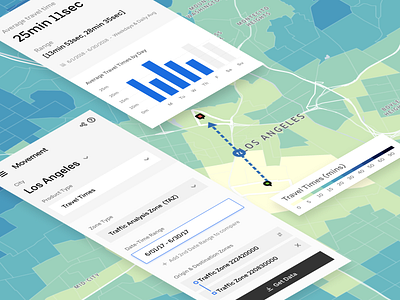
View Time Machine - Using Color to Explore Travel Time
Time Machine - Using Color to Explore Travel Time
Like
U_D
Pro
Like
80
96.4k
Shot Link
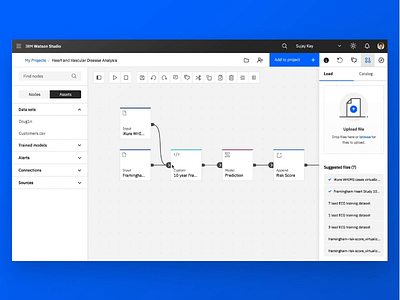
View Modeler
Modeler
Like
IBM
Team
Like
594
67k
Shot Link
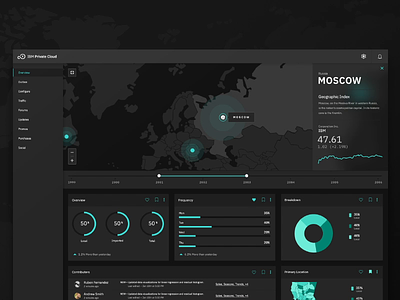
View Private Cloud Dashboard
Private Cloud Dashboard
Like
IBM
Team
Like
407
59.9k
1
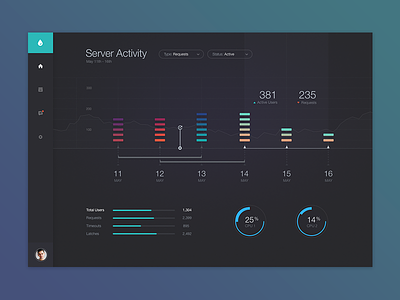
View Server Dashboard
Server Dashboard
Like
handsome
Team
Like
2.9k
305k
View Medical Statistic UI
Medical Statistic UI
Like
Andrew Sapkowski
Like
34
6.4k
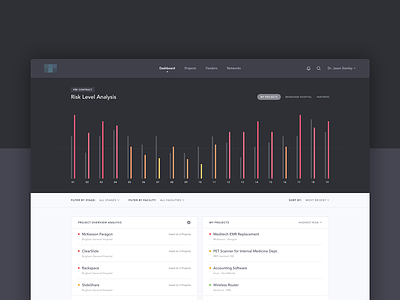
View Risk Level Analysis
Risk Level Analysis
Like
MojoTech
Team
Like
164
49.9k
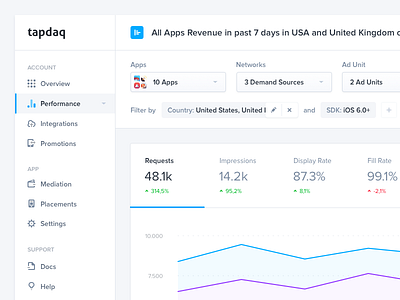
View Tapdaq 4.0 - Performance
Tapdaq 4.0 - Performance
Like
Jan Losert
Pro
Like
396
45.1k
Shot Link
View Material Desktop System for Figma has been announced!
Material Desktop System for Figma has been announced!
Like
Roman Kamushken
Like
48
20.5k
View Rejected Dashboard
Rejected Dashboard
Like
Dylan
Like
48
6.4k
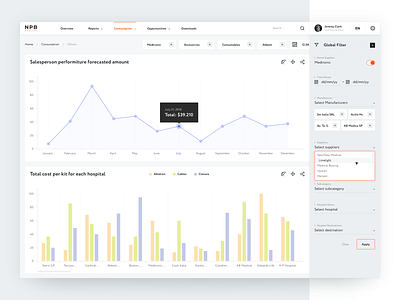
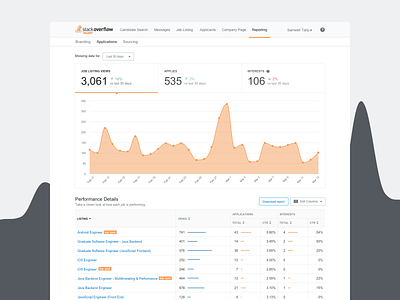
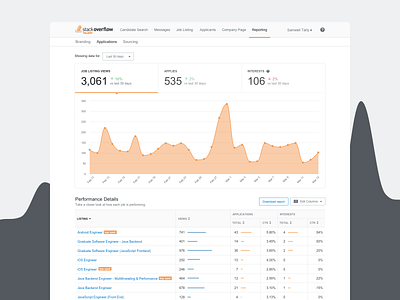
View Reporting Applications
Reporting Applications
Like
Stack Overflow
Team
Like
87
30.8k
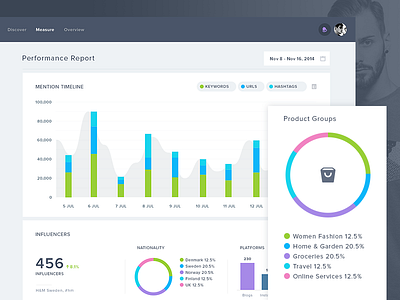
View Achoo - Report Page
Achoo - Report Page
Like
Balkan Brothers
Team
Like
330
30.1k
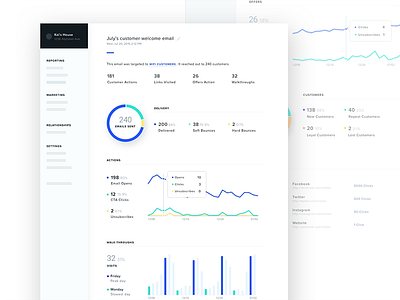
View Email Reporting Analysis
Email Reporting Analysis
Like
Nicole Jiang
Like
124
22.2k
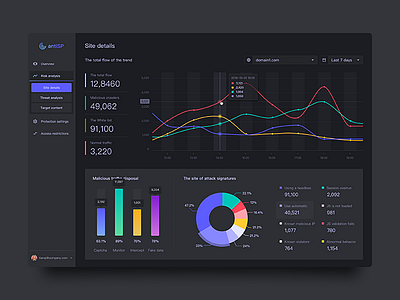
View Dashboard UI | Dark Theme
Dashboard UI | Dark Theme
Like
GeeTest
Team
Like
29
8.2k
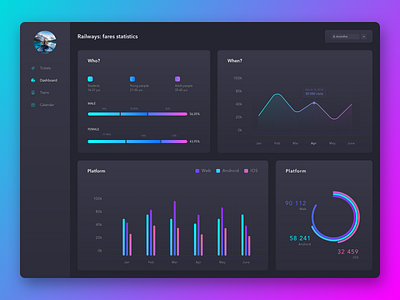
View Dashboard: railway tickets buying statistics
Dashboard: railway tickets buying statistics
Like
EPAM Design Team
Team
Like
288
38.9k
← Prev
Next →
Sign up to continue
Loading more…
Previous
Next
Loading…