Find designers
Designer search
Quickly find your next designer
Post a job
The #1 job board for design talent
Inspiration
Jobs
Go Pro
Log in
Dribbble: the community for graphic design
Log in
Sign up
Aaron Knoll
Denver, CO
Follow
Following
Blocked
Work
Collections
Liked Shots
About
Recent Shots
Recent Shots
Popular Shots
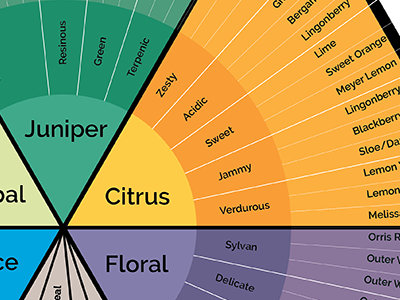
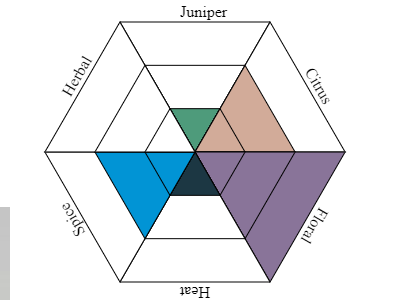
View Gin Tasting Diagram
Gin Tasting Diagram
Like
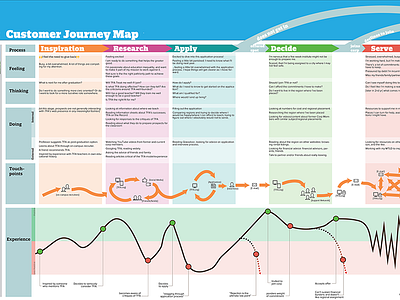
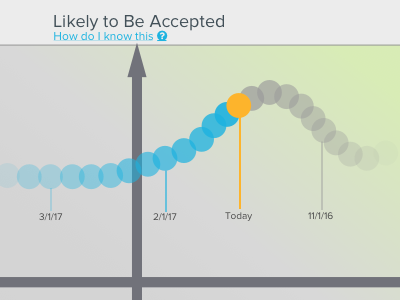
View Experience Mapping a Life Decision over 1–2 years....
Experience Mapping a Life Decision over 1–2 years....
Like
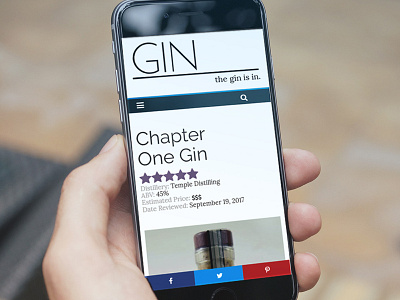
View The Gin is IN, Mobile Experience
The Gin is IN, Mobile Experience
Like
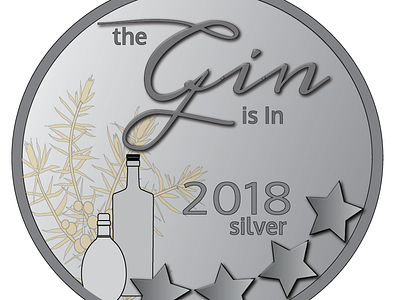
View The Gin is In, Silver Medal 2018
The Gin is In, Silver Medal 2018
Like
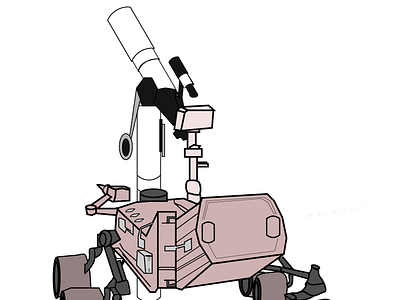
View The Mars Rover, Looking Longingly Back at Earth
The Mars Rover, Looking Longingly Back at Earth
Like
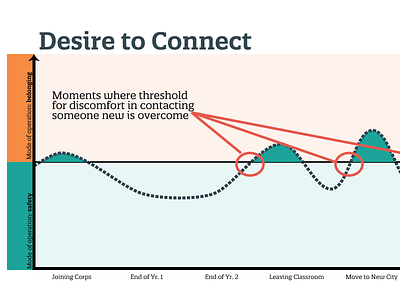
View Threshold Mapping: Desire To Connect
Threshold Mapping: Desire To Connect
Like
View Representing the Flavor of Gin
Representing the Flavor of Gin
Like
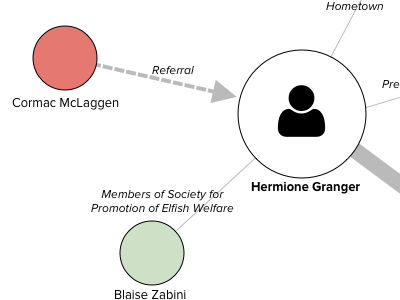
View Displaying Cognitive Insights
Displaying Cognitive Insights
Like
View Visualizing a Complex Campus Network
Visualizing a Complex Campus Network
Like
Sign up to continue
Loading more…
Previous
Next
Loading…