Dribbble: the community for graphic design
Shots
Shots
Designers
Services
Explore
Popular
New and Noteworthy
Product Design
Web Design
Animation
Branding
Illustration
Mobile
Typography
Print
Hire a Designer
Browse Freelancers
Purchase Services
Submit a Project Brief
Post a Full-Time Job
Find Jobs
Blog
Sign up
Log in
Chart
Facebook icon
Share
Twitter icon
Tweet
Copy
661 Shots
•
442 Designers
Antoine Plu
Facebook icon
Share
Twitter icon
Tweet
Copy
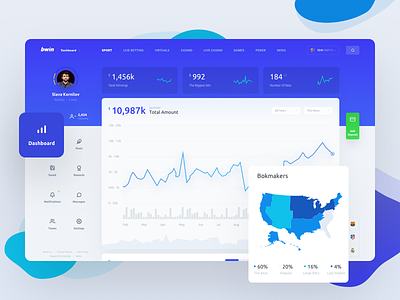
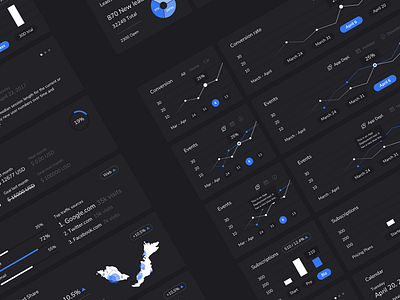
View bwin Dashboard
bwin Dashboard
Like
Geex Arts
Team
Like
430
48k
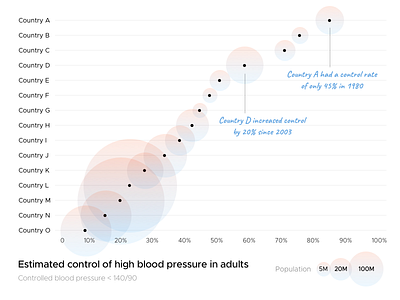
View Hypertension Control Chart
Hypertension Control Chart
Like
Daniel Burka
Like
48
9.5k
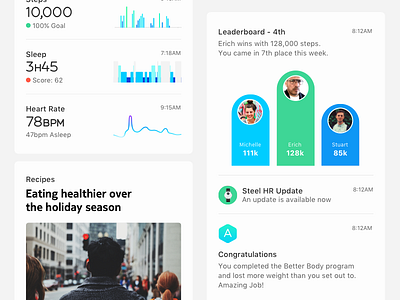
View Health Mate — Timeline Items
Health Mate — Timeline Items
Like
Withings
Team
Like
118
42.1k
Shot Link
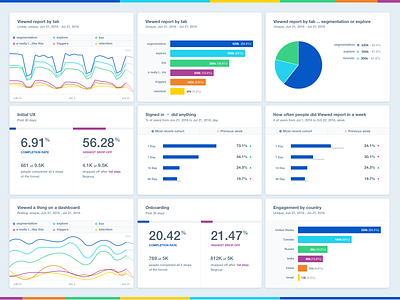
View Mixpanel Financial Services Report
Mixpanel Financial Services Report
Like
Mixpanel
Team
Like
202
16.1k
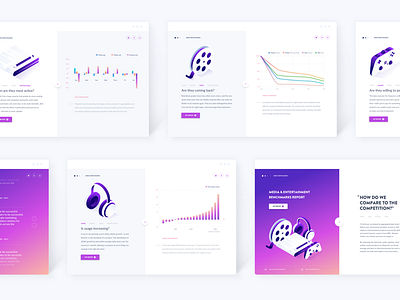
View M&E Benchmarks Screens
M&E Benchmarks Screens
Like
Mixpanel
Team
Like
188
18.5k
View New Reports Color
New Reports Color
Like
Mixpanel
Team
Like
191
19.1k
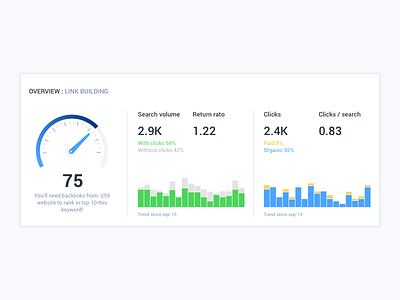
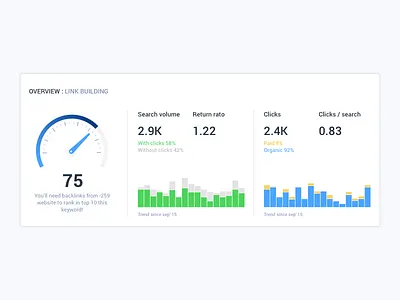
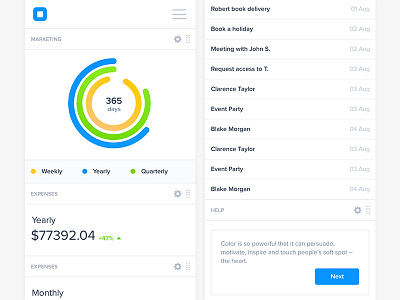
View Overview
Overview
Like
ziropixel
Like
54
18.1k
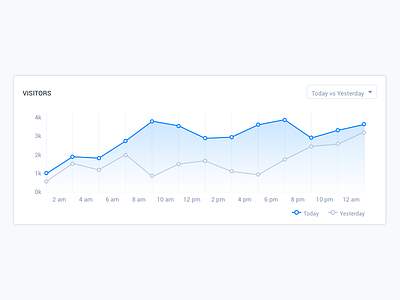
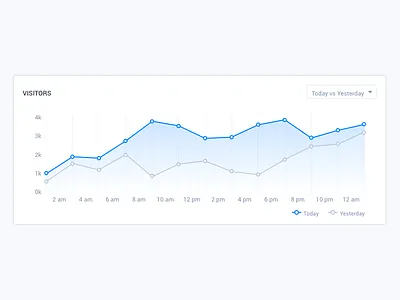
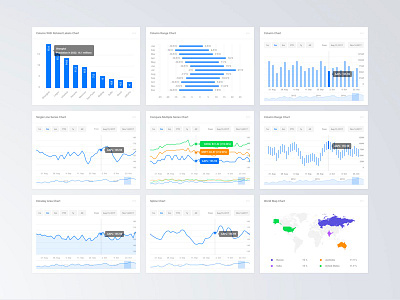
View Line graph
Line graph
Like
ziropixel
Like
37
8.3k
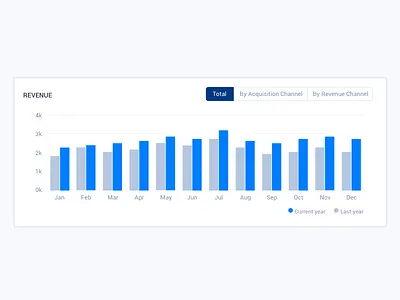
View Bar graph
Bar graph
Like
ziropixel
Like
30
6.4k
1
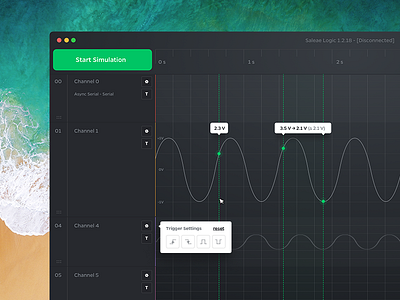
View Waves Part I
Waves Part I
Like
Mik Skuza
Pro
Like
283
26.2k
Shot Link
View Flow - Uber's Automation Engine
Flow - Uber's Automation Engine
Like
Uber
Team
Like
616
81.2k
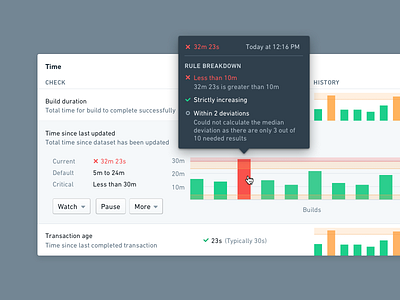
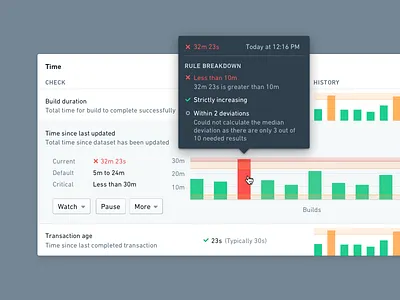
View Palantir Foundry: Data Health
Palantir Foundry: Data Health
Like
Palantir
Team
Like
298
62.4k
Shot Link
View OKR tree view modes
OKR tree view modes
Like
Gtmhub
Team
Like
391
62.3k
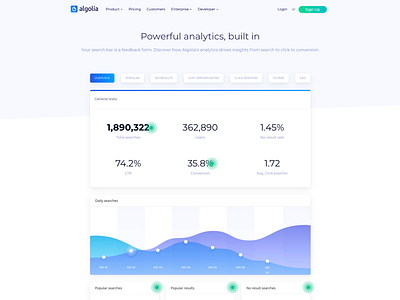
View Algolia analytics page
Algolia analytics page
Like
Algolia
Team
Like
159
9.8k
Shot Link
View Singapore Fintech Startup WIP
Singapore Fintech Startup WIP
Like
dvhb
Team
Like
61
6.5k
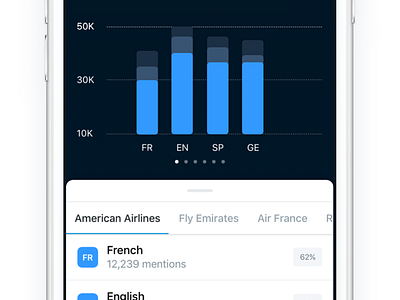
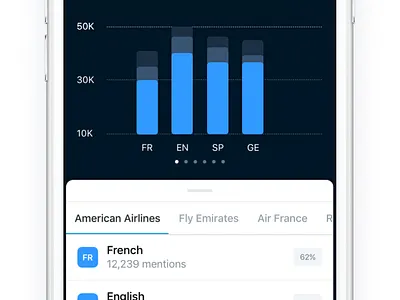
View Mobile Reports 📲
Mobile Reports 📲
Like
Mention
Team
Like
165
18.9k
View Charts 3 Part Cards
Charts 3 Part Cards
Like
Live Spline.one
Like
23
1.1k
View Exploring Charts
Exploring Charts
Like
Miuki Miu
Like
37
4.2k
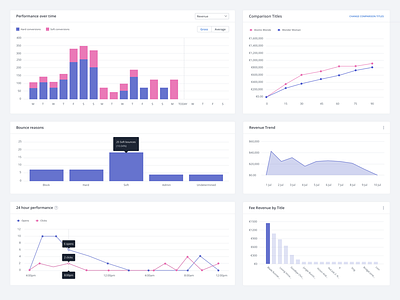
View Marketing Report UI
Marketing Report UI
Like
Pierluigi Giglio
Like
59
3.7k
View Market Metrics
Market Metrics
Like
Anatoly
Like
218
17k
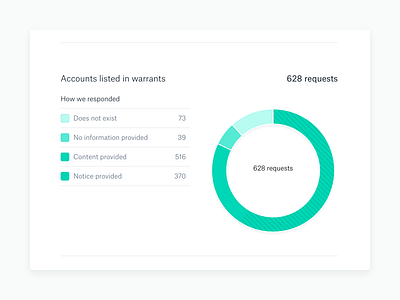
View Transparency - by request type
Transparency - by request type
Like
Dropbox Design
Team
Like
333
67.3k
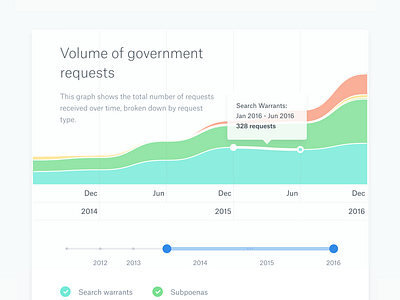
View Transparency - area chart
Transparency - area chart
Like
Dropbox Design
Team
Like
685
78.6k
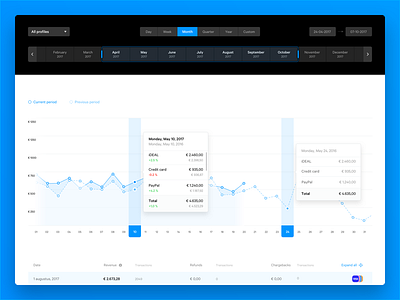
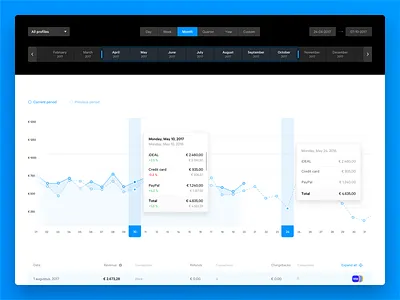
View The new Statistics
The new Statistics
Like
Mollie
Team
Like
401
74.4k
View Dashes, UI, Shapes and ...shapes.
Dashes, UI, Shapes and ...shapes.
Like
Robin
Team
Like
86
8.7k
← Prev
Next →
Sign up to continue
Loading more…
Previous
Next
Loading…