Hypertension Control Chart
I just started creating a graphing style for our data visualization at Simple.org
This is at an early stage and I would love feedback and critique on the style and design of this chart. Ideas on how to tell the story in this chart in better ways (I'm not sure this is the right type of chart to tell the story) are absolutely welcomed.
Rebounds would be appreciated if you're keen. I've attached the Sketch file. I'm using the free fonts Metropolis and Caveat, which you can download on the web.
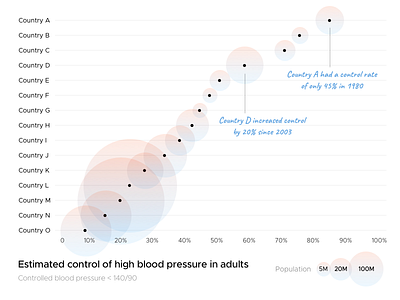
This chart shows the relative control of hypertension (high blood pressure) in countries around the world. Some countries have high levels of control, but their populations aren't as large as many of the countries who have unique challenges and large burdens of disease.