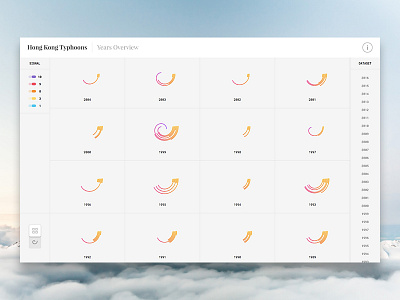
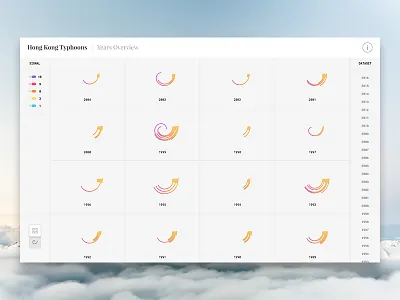
1. Audio Cuts
    View Audio Cuts
    Audio Cuts
    92
    4.3k
  2. Financials data economics finance financial graphs investment market shares stats stocks
    View Financials
    Financials
    155
    10.8k
  3. Select a flight prototype on Kiwi.com animation chart flights framer motion prototype table ui ux web website
    View Select a flight prototype on Kiwi.com
    Select a flight prototype on Kiwi.com
    135
    19k
  4. Dashboard Overview analytic clean dashboard manager overview project violet
    View Dashboard Overview
    Dashboard Overview
    85
    5.8k
  5. Task progress dashboard account dashboard data analytic digital graph ui interface metrics sketch user experience user interface ux web stats
    View Task progress dashboard
    Task progress dashboard
    129
    20.1k
  6. Collection of Charts analitycs blog chart dashboard flat free freebie graph sketch ui user panel vector
    View Collection of Charts
    Collection of Charts
    105
    10.7k
  7. Dashboard Reports analytics crm dashboard interface reports ui user interface ux web app web application web design
    1
    View Dashboard Reports
    Dashboard Reports
    291
    30.4k
  8. CRM Dashboard Reports analytics crm dashboard interface reports ui user interface ux web app web application web design
    View CRM Dashboard Reports
    CRM Dashboard Reports
    246
    16.3k
  9. Tiles card fraud interface radar series severity tiles time ui
    View Tiles
    Tiles
    158
    30.5k
  10. Dashboard application chart dashboard data java monitoring purple gradient user interface visualization
    View Dashboard
    Dashboard
    268
    18.9k
  11. Dashboard bounced chart dashboard data flow monitoring popover visualization waterfall
    View Dashboard
    Dashboard
    146
    22.8k
  12. IQM Visualization Interactions animation app design infographics interface ui ux web
    View IQM Visualization Interactions
    IQM Visualization Interactions
    846
    59.8k
  13. Reports analytics dashboard finacial interface reports ui user interface ux web app web design webdesign
    View Reports
    Reports
    171
    9.5k
  14. Hong Kong Typhoons Data Visualization Grid d3js data data visualization dataviz grid history hong kong illustration photoshop statistics storm typhoon
    View Hong Kong Typhoons Data Visualization Grid
    Hong Kong Typhoons Data Visualization Grid
    164
    14k
  15. Agile CRM - Home Ver2 analytics balkan brothers charts clean crm dashboard data interface tasks ui user experience ux
    View Agile CRM - Home Ver2
    Agile CRM - Home Ver2
    1.3k
    105k
  16. Statistics alpha app cards iadvize ibbu interface ios mobile statistics stats ui ux
    1
    View Statistics
    Statistics
    84
    6.1k
  17. Line Graphs blue clean graph line metrics minimal month subtle ui ux year
    View Line Graphs
    Line Graphs
    25
    2.3k
  18. Tapdaq - Insights WIP 2 app dashboard export graph ios performance profile stats summary table time ui
    View Tapdaq - Insights WIP 2
    Tapdaq - Insights WIP 2
    421
    59.2k
  19. Donut Charts charts delicious donut graphs metrics mmm pie ui ux
    View Donut Charts
    Donut Charts
    21
    2.1k
  20. Bar Graphs bar beer blue drunk graph interface metrics stats ui ux
    View Bar Graphs
    Bar Graphs
    24
    2.4k
  21. Upcoming Buffer Twitter Overview Analytics analytics overview
    View Upcoming Buffer Twitter Overview Analytics
    Upcoming Buffer Twitter Overview Analytics
    97
    6.4k
  22. Lush | Stats Search cosmetics dashboard data fresh handmade lush statistics stats ui design
    View Lush | Stats Search
    Lush | Stats Search
    57
    2.4k
  23. Consumption Analytics analytics consumption dashboard data downloads files graph icons listen mobile read watch
    View Consumption Analytics
    Consumption Analytics
    65
    5.1k
  24. Data Visualization Styles dashboard data graphs ui windows
    View Data Visualization Styles
    Data Visualization Styles
    104
    6.4k
Loading more…