1. Radar Traffic Report charts checkbox dashboard dropdown gradient map radio table ui user interface
    View Radar Traffic Report
    Radar Traffic Report
    73
    6.1k
  2. Analytic dashboard analytic dashboard graph graphs web
    View Analytic dashboard
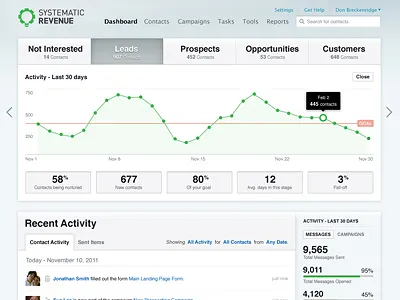
    Analytic dashboard
    387
    15.2k
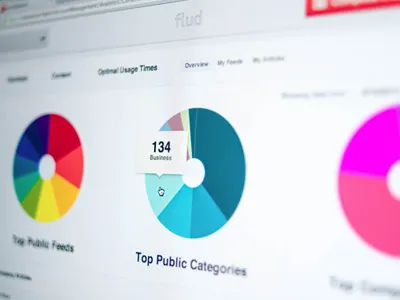
  3. News dashboard for companies analytics app business dashboard data enterprise flud ios ipad iphone marketing media mobile news social social enterprise ui user experience user interface ux web website
    1
    View News dashboard for companies
    News dashboard for companies
    79
    8k
  4. Poker Dashboard analytics app blue circles dark dashboard icons interface nav poker profile statistics stats ui ux web app web design
    View Poker Dashboard
    Poker Dashboard
    172
    11k
  5. Pull Dashboard Application app chart dashboard data graph icons ui visualization widget
    View Pull Dashboard Application
    Pull Dashboard Application
    81
    3.9k
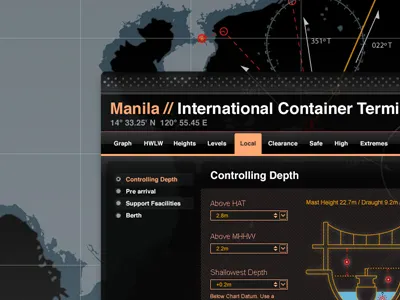
  6. Marine navigation software concept black ui dropdown menu dropdown menu dropdown menu marine navigation ship shipping software tabs ui
    View Marine navigation software concept
    Marine navigation software concept
    9
    1.3k
  7. Gaug.es 2.0 dark gauges redesign
    View Gaug.es 2.0
    Gaug.es 2.0
    359
    7.3k
  8. iPad UI ipad ui
    View iPad UI
    iPad UI
    308
    10.1k
  9. Dashboard Design analytics dashboard interface reports ui user interface ux web app web application web design
    View Dashboard Design
    Dashboard Design
    503
    26k
  10. Preview Tool appstore comment design feedback free freebie helvetica icons interface reporting tool ui
    View Preview Tool
    Preview Tool
    142
    7.3k
  11. Tabbed app black clean concept corporate creative design fresh graphic grey icon iphone personal photoshop red stars tab ui ux web design webdesign website white wip
    View Tabbed
    Tabbed
    124
    8.9k
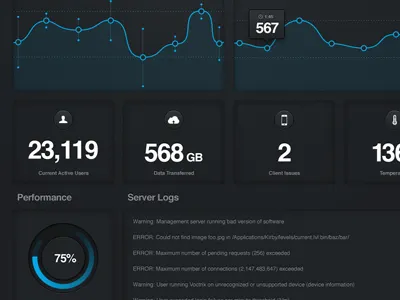
  12. Server Stats App app blue concept contrast dark data graph infographic progress bar statistics stats ui ux visualization web
    View Server Stats App
    Server Stats App
    58
    8k
  13. Campaign List Sketch app dark dashboard eye graph heart highlight icons list logo metrics numbers product sketch sparkline statistics symbol typography web app
    View Campaign List Sketch
    Campaign List Sketch
    54
    5.9k
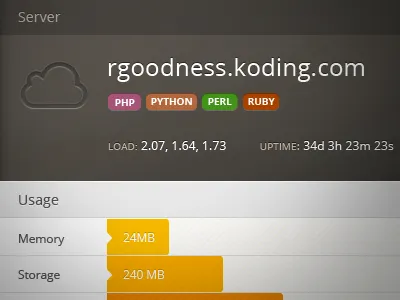
  14. Server Settings cloud graph koding settings ui
    View Server Settings
    Server Settings
    50
    2.3k
  15. Some timeline fun graph map timeline
    View Some timeline fun
    Some timeline fun
    63
    2.9k
  16. Map and chart chart glow graph green map red
    View Map and chart
    Map and chart
    80
    2.8k
  17. Statistics Graph chart dashboard graph map report statistics stats
    View Statistics Graph
    Statistics Graph
    14
    1.3k
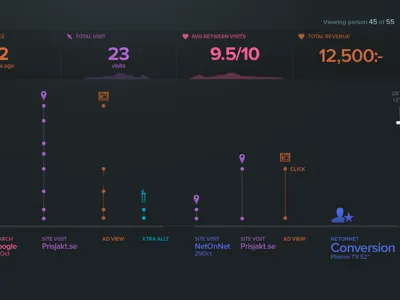
  18. Conversion Timeline app conversion dark data dataviz graph infographic infoviz linegraph metrics numbers product sparkline statistics timeline ui ux viz webapp
    View Conversion Timeline
    Conversion Timeline
    146
    14.9k
  19. Momeant Analytics analytics chart graph momeant stats
    View Momeant Analytics
    Momeant Analytics
    76
    3k
  20. Report Analytics analytics data graph list report statistic ui ux
    View Report Analytics
    Report Analytics
    216
    14.1k
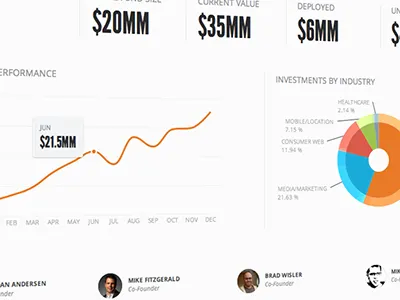
  21. Data View avatars circles data donut chart highcharts numbers pie chart spline
    View Data View
    Data View
    38
    5.6k
  22. Charity Metrics bar chart charity dashboard update
    View Charity Metrics
    Charity Metrics
    119
    6.3k
  23. Date Range Selector & Chart Final ✔ analytic app calendar dashboard date design detail dropdown graph graphic gui header icon interface line metric minimalist navigation pop pop up selector sidebar simple stats ui up ux visitor web white
    View Date Range Selector & Chart Final ✔
    Date Range Selector & Chart Final ✔
    144
    19k
  24. Graph graph information design motion
    View Graph
    Graph
    77
    4.5k
Loading more…