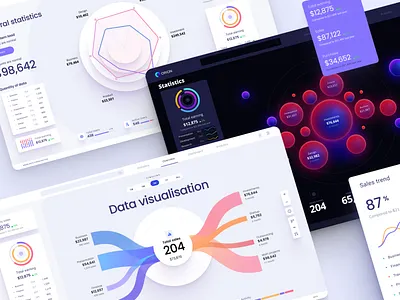
1. [WIP] Some data visualization #2 🔶 analitycs app chart color dashboard data design graph graphic pie chart statistic ui uiux ux
    1
    View [WIP] Some data visualization #2 🔶
    [WIP] Some data visualization #2 🔶
    590
    112k
  2. Widgets library for dashboards and presentations chart dashboad data vusialisation dataviz design system desktop figma infographic library presentation product saas service technology template widgets
    View Widgets library for dashboards and presentations
    Widgets library for dashboards and presentations
    631
    268k
  3. Charts templates & infographics in Figma analytics chart chart dashboard data data vusialisation dataviz desktop infographic product template
    View Charts templates & infographics in Figma
    Charts templates & infographics in Figma
    659
    303k
  4. TNLB / Research Lab 3d design flat font glass icon research site typography web
    View TNLB / Research Lab
    TNLB / Research Lab
    1.2k
    173k
  5. ExCh app application chat expert green interface ios iphone x ui ux 🕺
    1
    View ExCh
    ExCh
    471
    31.7k
  6. Transparency - area chart area chart data infographic slider ui web
    View Transparency - area chart
    Transparency - area chart
    685
    78.4k
  7. Grav CRM – Dashboard account dashboard graph infographic interface minimal reports stats ui ux
    View Grav CRM – Dashboard
    Grav CRM – Dashboard
    563
    81.2k
  8. iPhone X UI - Dashboard app dashboard design infographic ios iphone x minimal screens shadow statistics ui white
    1
    View iPhone X UI - Dashboard
    iPhone X UI - Dashboard
    451
    34.2k
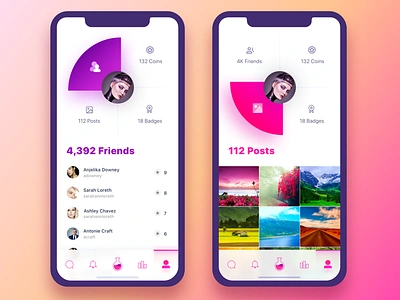
  9. Fame Lab Profile comments fame famous followers gamification infographic instagram iphone x likes profile stats
    2
    View Fame Lab Profile
    Fame Lab Profile
    507
    83.6k
  10. Bitcoin Analytics Dashboard analytics bictoin btc dashboard date infographic ios sort stats ui ux web design
    View Bitcoin Analytics Dashboard
    Bitcoin Analytics Dashboard
    314
    32.5k
  11. Personal data in InVision’s 2016 Year in Review 2016 animation cards end gradients invision of prototyping responsive review timeline year
    View Personal data in InVision’s 2016 Year in Review
    Personal data in InVision’s 2016 Year in Review
    1k
    125k
  12. Presenting the 2016 Product Design Report, from InVision design infographic invision report
    View Presenting the 2016 Product Design Report, from InVision
    Presenting the 2016 Product Design Report, from InVision
    1.5k
    87.8k
  13. Bureau Oberhaeuser Calendar 2018 2018 calendar circle infographic information design kalender new year
    View Bureau Oberhaeuser Calendar 2018
    Bureau Oberhaeuser Calendar 2018
    272
    31.7k
  14. Designer Vacay chart data data visualization data viz graph infographic london map
    View Designer Vacay
    Designer Vacay
    447
    31.7k
  15. Product Features business chart graph header illustration infographic interface messenger presentation responsive ux web
    View Product Features
    Product Features
    1.9k
    170k
  16. DFA Stats dfa dubai graph infographic pie chart stats
    View DFA Stats
    DFA Stats
    415
    40.1k
  17. Print House website - WIP chart design grey infographic orange web
    View Print House website - WIP
    Print House website - WIP
    1.8k
    109k
  18. Swiss style dark/white dashboard analytics apps dashboard infographic ios saas service stat style swiss ui ux
    View Swiss style dark/white dashboard
    Swiss style dark/white dashboard
    897
    104k
  19. Media Economy Report Vol. 10 chart data visualization editorial graph infographic information design magazin sport
    View Media Economy Report Vol. 10
    Media Economy Report Vol. 10
    152
    25.8k
  20. Red Sox Scores: October 1, 2016 baseball chart charts data data visualisation data viz graph infographic minimal minimalism sports
    View Red Sox Scores: October 1, 2016
    Red Sox Scores: October 1, 2016
    253
    15.5k
  21. Discover - The cost of raising a child baby buggy chair child illustration infographic line pram push skyline stroller usa
    1
    View Discover - The cost of raising a child
    Discover - The cost of raising a child
    135
    13.3k
  22. Tapdaq Story Infographic apps behance graph infographic landing performance profile stats summary table ui web
    View Tapdaq Story Infographic
    Tapdaq Story Infographic
    623
    78.9k
Loading more…