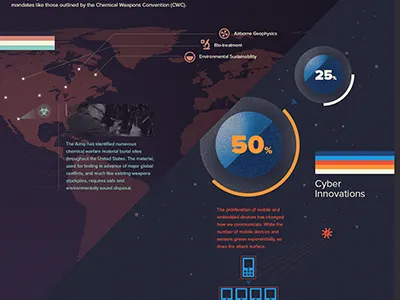
1. Broadband Adoption america chart ethernet infographic map patriotic percentages politics stats teamengage united states
    View Broadband Adoption
    Broadband Adoption
    123
    9.3k
  2. Starbase Infographics graph infographic stats ui web design
    View Starbase Infographics
    Starbase Infographics
    9
    1.2k
  3. Infographic Concept Board charts icons infographic map percents
    1
    View Infographic Concept Board
    Infographic Concept Board
    27
    1.2k
  4. Energy Graph circle graph data graph info graphic visualization
    View Energy Graph
    Energy Graph
    21
    2.4k
  5. Utility Monitoring Dashboard app application graph ipad mobile monitor tablet utilities
    View Utility Monitoring Dashboard
    Utility Monitoring Dashboard
    15
    1.5k
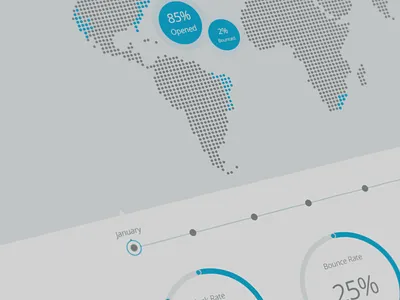
  6. Reports chart email graph reports web application
    View Reports
    Reports
    37
    1.9k
  7. Infographic // Seven Superfoods to help you live longer 7 superfoods amazing super foods boy illustration food information design health infographic healthy infographic illustration infographic infographic infographics information design seven super foods superfoods
    View Infographic // Seven Superfoods to help you live longer
    Infographic // Seven Superfoods to help you live longer
    20
    1.1k
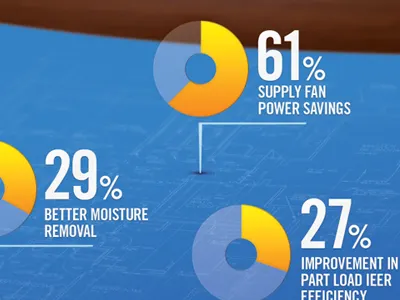
  8. Engineering Savings Graphic blue blueprint circle chart comp infographic print web yellow
    View Engineering Savings Graphic
    Engineering Savings Graphic
    17
    2.6k
  9. E. coli pie bacteria data infographic ngo non profit percent pie chart splash water
    1
    View E. coli pie
    E. coli pie
    7
    1.5k
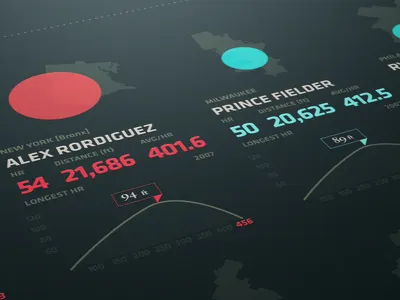
  10. Charting 5 years of MLB homeruns baseball blue chart dark data graph green infograph infographic maps mlb numbers red stats
    View Charting 5 years of MLB homeruns
    Charting 5 years of MLB homeruns
    1.4k
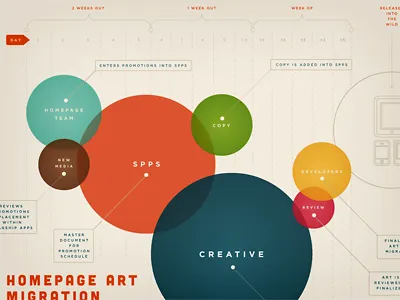
    120k
  11. Making Internal Charts Fun chart circles dots infograph infographic lines process timeline
    View Making Internal Charts Fun
    Making Internal Charts Fun
    347
    25.2k
  12. Working on something chart data graph health image line medical pie chart wip
    View Working on something
    Working on something
    110
    10.6k
  13. Vox By The Numbers infographic vox media year in review
    View Vox By The Numbers
    Vox By The Numbers
    30
    1.7k
  14. Free PSD infographic! contest design element flash free giveaway graphic html infographic psd skills ui vector
    View Free PSD infographic!
    Free PSD infographic!
    105
    5.6k
  15. Media Economy Report Infographic analytics data donut pie chart report statistic ui ux
    View Media Economy Report Infographic
    Media Economy Report Infographic
    527
    42.2k
  16. Olympia survey infographic detail chart data editorial infographic magazin olympia stats survey
    View Olympia survey infographic detail
    Olympia survey infographic detail
    114
    7.9k
Loading more…