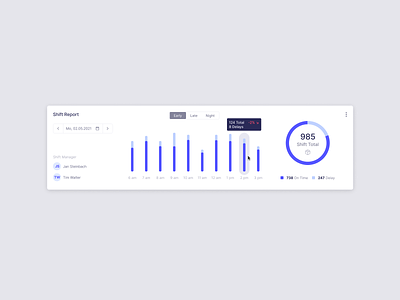
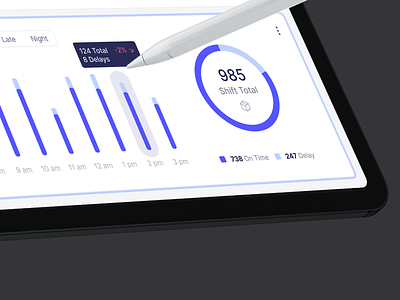
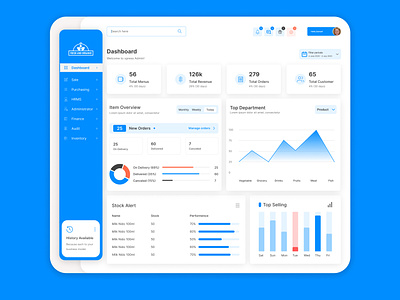
Data Graph

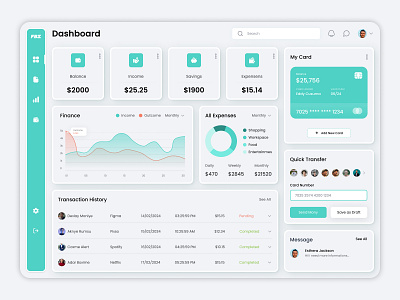
Inspirational designs, illustrations, and graphic elements from the world’s best designers.
Want more inspiration? Browse our search results...

  1. Dashboard component bar chart column chart container dashboard data graph data tip donut chart modern design tooltip ui ui component ui design ux web app
    View Dashboard component
    Dashboard component
    70
    40.2k
  2. Datatip on stacked column chart apple pen column chart dashboard data graph datatip factory industry interaction design logisitics tablet tooltip ui design ux
    View Datatip on stacked column chart
    Datatip on stacked column chart
    43
    30.3k
  3. Kizen - Deal Revenue Leaderboard bar graph bars data data graph graph key modal ui ux
    View Kizen - Deal Revenue Leaderboard
    Kizen - Deal Revenue Leaderboard
    184
    55.4k
  4. Data Results data data graph graph illustration man people results woman
    View Data Results
    Data Results
    108
    11k
  5. Admin dashboard: analytics UX admin dashboard admin panel app design control panel dashboard design dashboard template data chart data graph design graph chart infographic dashboard inforformation chart landing page merketing dashboard ui ui design ux ux design web template website design
    View Admin dashboard: analytics UX
    Admin dashboard: analytics UX
    26
    2.2k
  6. Classy Graph beautiful graph classy graph data graph graph graph ui
    View Classy Graph
    Classy Graph
    122
    8.6k
  7. Dashboard experiment #02 analytics chart dashboard data analytics data graph data usage date picker enterprise mobile app overview
    View Dashboard experiment #02
    Dashboard experiment #02
    145
    42.8k
  8. UI Dashboard your credit score adobe adobexd app app design clean style credit cards credit score dashboard app dashboard design dashboard ui data graph moralesfreelance ui ux uix
    View UI Dashboard your credit score
    UI Dashboard your credit score
    171
    47.5k
  9. Dashboard experiment #01 analytics analytics chart collapsed menu dashboard data graph design system icon overview side menu ui web admin
    View Dashboard experiment #01
    Dashboard experiment #01
    178
    45.6k
  10. Tweet Wall v3 bar chart black blue css3 dark data graph green grey pink twitter visualization white
    1
    View Tweet Wall v3
    Tweet Wall v3
    4
    1k
  11. Marathon Data graph/Pie chart Animation aftereffects data analysis data graph logo animation marathon motion design motion graphics motiongraphics pie chart ui
    View Marathon Data graph/Pie chart Animation
    Marathon Data graph/Pie chart Animation
    9
    3.1k
  12. Quadrant || Analytics clean dark mode dashboard data graph design graphs minimal product desing reports search bar sidebar ui ux web design
    View Quadrant || Analytics
    Quadrant || Analytics
    3
    736
  13. Finance Dashboard Design banking business chart business infographic cash management corporate template dashboard design dashboard template data graph debt management economy excel dashboard exchange finance dashboard financial dashboard excel financial growth financial illustration graphic design infographic template ui uiux design
    View Finance Dashboard Design
    Finance Dashboard Design
    0
    125
Loading more…