1. Spendesk Radar: Realtime map of transactions bank banking dark ui data datavisualization dataviz interface maps money stats ui user inteface
    View Spendesk Radar: Realtime map of transactions
    Spendesk Radar: Realtime map of transactions
    64
    39.3k
  2. Chargetrip : API internal developer tools api developer documentation electric vehicles routing
    View Chargetrip : API internal developer tools
    Chargetrip : API internal developer tools
    136
    38.6k
  3. Onefootball App app bet card chart clean component design football live mixture mobile news onefootball poll soccer stats table ticker ui ux
    View Onefootball App
    Onefootball App
    61
    46.6k
  4. Boltz blue crypto website white
    View Boltz
    Boltz
    117
    22.1k
  5. Even.com - App Features Carousel app carousel clean design finance layout minimal paper illustration slideshow transition ui ux web design website
    View Even.com - App Features Carousel
    Even.com - App Features Carousel
    445
    184k
  6. Connect Microsite animation connect landing page marketplaces platforms product
    View Connect Microsite
    Connect Microsite
    411
    75.5k
  7. Sales Funnel analytics chart dark dashboard funnel graph sales ui
    View Sales Funnel
    Sales Funnel
    1k
    105k
  8. iPad Dashboard chart dashboard data gif graph grid map metrics statistics stats typography ui
    View iPad Dashboard
    iPad Dashboard
    1.2k
    135k
  9. Plottable.JS analytics bar chart data graph grid library line plot scatter ui
    View Plottable.JS
    Plottable.JS
    146
    41.1k
  10. Data visualization with Polaris dashboard data visualization dataviz graph shopify polaris
    View Data visualization with Polaris
    Data visualization with Polaris
    118
    11.3k
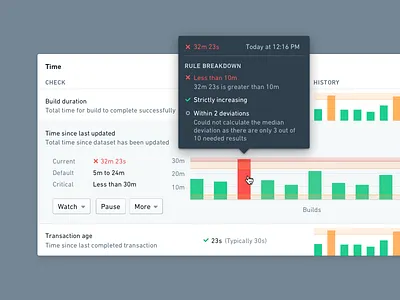
  11. Palantir Foundry: Data Health chart checks dashboard data dropdown enterprise graph health palantir popover visualization
    View Palantir Foundry: Data Health
    Palantir Foundry: Data Health
    297
    61.7k
  12. Roadmap History app icons minimal planning project roadmap sidebar simple timeline
    View Roadmap History
    Roadmap History
    373
    60.2k
  13. Kanban Record Popover activity feed contact crm modal pipeline popover product relationship stages timeline ui ux
    View Kanban Record Popover
    Kanban Record Popover
    555
    239k
  14. spaces analytics chart clean data density design simple ui
    View spaces
    spaces
    45
    3.8k
  15. Uber Movement for New Mobility | Card Interaction card ui data data design data viz geospatial gif map viz uber uber design ui design
    View Uber Movement for New Mobility | Card Interaction
    Uber Movement for New Mobility | Card Interaction
    600
    146k
  16. Logistics dashboard analysis analytics dashboard dashboard heatmap internet of things iot map moeco saas sensors stages
    View Logistics dashboard
    Logistics dashboard
    173
    54.6k
  17. Hoop Customer Feedback Dashboard activity app customer dashboard data design feedback hoop ios kids rating ratings review reviews stars ui ux uxd web web app
    View Hoop Customer Feedback Dashboard
    Hoop Customer Feedback Dashboard
    198
    54.1k
  18. Home value components comps estate graph home modules product system ui
    View Home value components
    Home value components
    87
    11.5k
  19. Dashboard analytics dashboard interface reports ui user interface ux web app web application web design
    View Dashboard
    Dashboard
    106
    11k
  20. Todays Snapshot 📊 dashboard dashboard app dashboard ui design icon design icons interface interfacedesign saas app ui user experience user interface ux
    View Todays Snapshot 📊
    Todays Snapshot 📊
    188
    36.5k
  21. Dashboard UI home house layout product ui web
    View Dashboard UI
    Dashboard UI
    380
    75.7k
  22. Designing for Open Source Charting Library analytics article chart d3 data library open source
    View Designing for Open Source Charting Library
    Designing for Open Source Charting Library
    166
    10.9k
  23. Exchange – Revenue & Traffic Graphs buy charts data gradient graphs purple revenue sell shopify stores traffic
    View Exchange – Revenue & Traffic Graphs
    Exchange – Revenue & Traffic Graphs
    115
    19.6k
  24. Overview bar graph chart data graph line graph meter speed
    View Overview
    Overview
    54
    17.9k
Loading more…