1. Judy Garland Info 2 final infographics judy garland map student work vintage
    View Judy Garland Info 2
    Judy Garland Info 2
    11
    944
  2. Going Global Infographic ad chart color e commerce graphic illustration infographic layout lost type paper print retro texture type typography vintage
    View Going Global Infographic
    Going Global Infographic
    537
    47.8k
  3. Energy Infographic chart energy green infographic typography
    View Energy Infographic
    Energy Infographic
    21
    1k
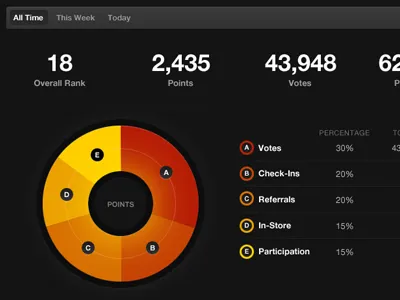
  4. Pie! breakdown bright chart circle contrast dark dashboard data fire graph helvetica numbers pie spooky stats
    1
    View Pie!
    Pie!
    386
    27.9k
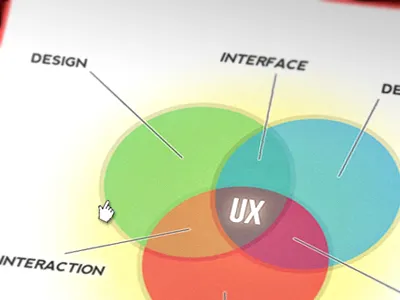
  5. The Infography Project circles design development diagram fake photograph infographic interaction interface tricolor user experience ux venn
    View The Infography Project
    The Infography Project
    112
    9.2k
  6. Xmas tree-shaped infographic, BIG
    View Xmas tree-shaped infographic, BIG
    Xmas tree-shaped infographic, BIG
    145
    4.9k
  7. Frozen Planet - Illustration facts green icons iconset minimal stats texture tv
    1
    View Frozen Planet - Illustration
    Frozen Planet - Illustration
    170
    6.2k
  8. Thermometer gray grey thermometer ui
    View Thermometer
    Thermometer
    23
    1.6k
  9. Graphs and Stats Mood Board 2d chart dashboard elements flat graph line mood board pie semi statistics stats widgets
    View Graphs and Stats Mood Board
    Graphs and Stats Mood Board
    16
    2.4k
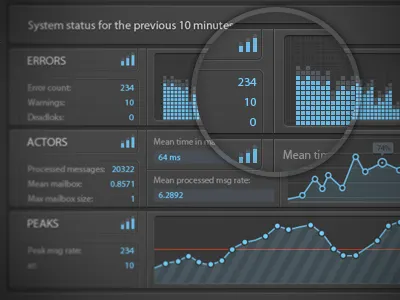
  10. Stats Dashboard console - UI/UX app css3 dashboard graph html5 icons ui user interface
    View Stats Dashboard console - UI/UX
    Stats Dashboard console - UI/UX
    698
    36.7k
  11. Where We Work
    View Where We Work
    Where We Work
    14
    678
  12. Dashboard Analytics analytics dashboard interface reports ui user interface ux web app web application web design
    View Dashboard Analytics
    Dashboard Analytics
    512
    29.1k
  13. HOM research charts data graphic graphs info info graphics infographic information graphics visualization
    View HOM research
    HOM research
    30
    1.9k
  14. HOM research2 charts colorful data graphic graphs info info graphics infographic information information graphics visualization
    View HOM research2
    HOM research2
    95
    5.5k
  15. Launch Info Graphic 4 column five info graphic launch
    View Launch Info Graphic 4
    Launch Info Graphic 4
    82
    2.6k
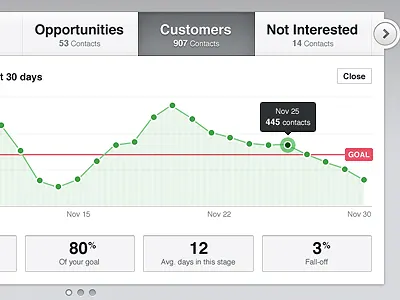
  16. Web App Statistics blue chart data graph green helvetica orange pictos proxima nova soft statistics
    View Web App Statistics
    Web App Statistics
    624
    35.4k
  17. Gaug.es 2.0 Overview blue gauges green overview
    View Gaug.es 2.0 Overview
    Gaug.es 2.0 Overview
    105
    3.4k
  18. Wired Electric Cars - the big version
    View Wired Electric Cars - the big version
    Wired Electric Cars - the big version
    138
    4.1k
  19. Earth Bread + Brewery Diagram
    View Earth Bread + Brewery Diagram
    Earth Bread + Brewery Diagram
    129
    4.7k
  20. StudPress clean design simple theme wordpress wp
    1
    View StudPress
    StudPress
    121
    3.7k
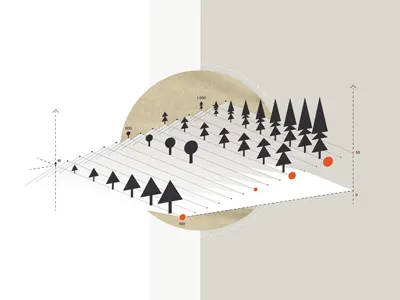
  21. Tree Chart chart forest infographic tree
    View Tree Chart
    Tree Chart
    120
    7.1k
  22. Gauge
    View Gauge
    Gauge
    75
    2.3k
  23. 2.Converted аlgorithm Bitcoin2 bitcoin economy service
    View 2.Converted аlgorithm Bitcoin2
    2.Converted аlgorithm Bitcoin2
    9
    804
  24. Phil Connors presents A Guide to Surviving Groundhog Day bill murray groundhog day hero design studio illustration infographic poster screenprint
    View Phil Connors presents A Guide to Surviving Groundhog Day
    Phil Connors presents A Guide to Surviving Groundhog Day
    48
    2.5k
Loading more…