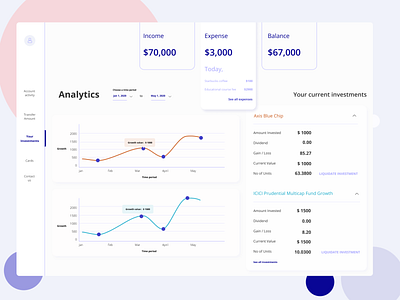
Daily UI Challenge - Day 4 Bank Investment Dashboard
Hello! This is my first tryst with a data analytics chart.
I have tried to use real-time data to see how I would represent my investment in an easy manner
The color might look a bit different here. pardon the quality.
I have tried to be inspired from an UI mockup kit, add a feature where upon hovering on the Income / Expenses / Balance Tags, it would expand down a bit to give a sneak peek about transactions or relevant details.
I have also used elevation to differentiate containers in an attempt to not make it look too flat.
More by Akanksha Biswas View profile
Like
