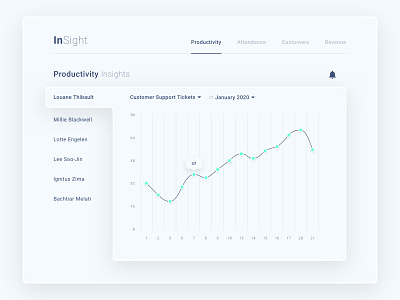
Daily UI #018 | Analytics Chart
Not all companies are able to efficiently track the productivity of their employees to find the weak links within their production teams. Supervisors may not always have time to keep an eye on the production, and sometimes employees have to manually keep track of their productivity as well. Which might not always happen truthfully. Thus, manipulating the end data.
The design that I made today should solve these problems by allowing to track different kind of statistics regarding the productivity of employees of the company.
The possible interactions should be made clear. For example, being able to select different employees and to select the month and the type of statistics to be analysed.
Let me know what you think!
More by Jeffrey Thümann View profile
Like
