Slopegraph tryouts
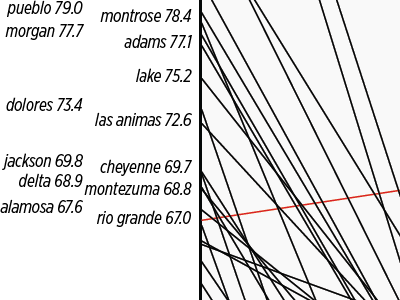
Working on using county-level data birth rates (# of births per 1,000) to show changes in rates over time using a slopegraph. About 130 datapoints to work with, and a narrow, tall space. Hard part is the counties that have data points so close to each other. Trying this stagger approach to the text first.