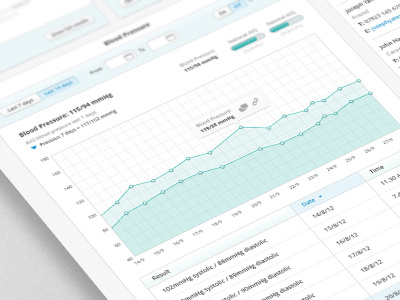
Patient Record Dashboard
It's been a busy week over here, we've just launched our new homepage and also made some huge improvements to the patient record, with our new version that's just gone live.
You can now track a number of different measurements in detail:
- Blood Pressure
- Peak Flow
- Dietary Intake
- Blood Glucose
- Height
- Exercise
- Weight
You can also record your allergies, conditions and medications. Soon we'll be adding the ability to record a number of other things including your family history, immunisations and procedures.
The record is made out of a number of modules which you can rearrange, hide and expand. When you expand a module, you are shown a larger chart which allows you to filter the data via a date range and with some of the measurements it also gives you the ability to plot a national average line on the graph.
It was our soft launch yesterday, everyone's worked really hard on this project and we'll be continuously adding features to it over the next year.
SJ did an amazing job on the front end build again with this one, she worked her magic with the D3 charting library to.
Check out the attachment for more details and some of the upcoming features, or alternatively you can go and try the demo through our new homepage.

