Infographic
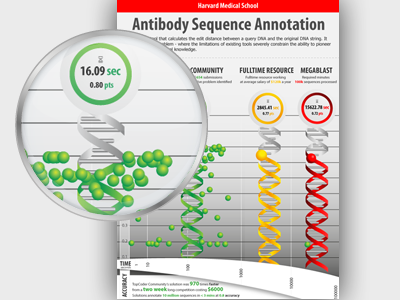
Data visualization for a comparison of solutions to a gene-sequencing problem. Using Time on a logarithmic X-axis and Accuracy on the Y-axis, different solutions were plotted as points on a double helix
More by Grishma Rao View profile
Like
