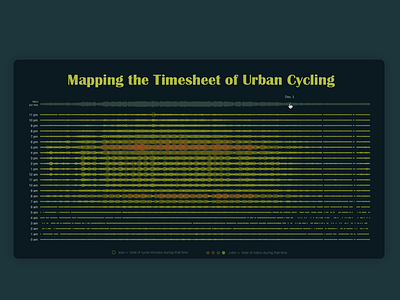
Mapping Urban Cycling - Data Visualization
This work was longlisted for Kantar Information is Beautiful Awards 2017. It explores the time-based patterns and relevant benefits regarding cycling. The idea is to encourage people to bike more by promoting the cycling benefits from the perspectives of individual health and the sustainability of the urban environment.
More about this project: http://spark.go4trees.com/projects/data-viz/#mapping-the-timesheet-of-urban-cycling
More by Liuhuaying Yang View profile
Like
