Utility Tracking App - XD Daily Challenge: Oct 3, 2019
Hello Dribbblers!
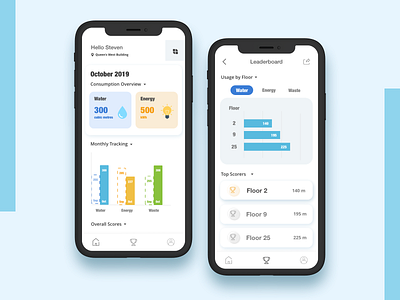
This is my go at this month's Adobe XD's Daily Challenge. The task was to create a dashboard that displays waste, water and energy usage for a community or building and gamifiy the design by tracking and ranking performance between floors or members.
I had a lot of fun making this one! I started out with research on current utility dashboards to see what information I thought would be important to users. I later sketched out my designs on paper to give me a rough idea. Then transferred to Adobe XD as high fidelity mockups with simple prototyping.
Wouldn't it be cool if we had an app like this? Seeing your numbers could make you more conscious of your habits and it can be motivating and rewarding seeing your individual progress.
I've been loving the prototyping feature on Adobe XD, it's so much easier to go back and forth. Auto Animate is a game changer too. Although I always like my good old Sketch, XD has come a long way and they're rapidly improving.
Anyway hope you guys like it! Feedback is greatly welcomed :)