Financial Table with Tooltip
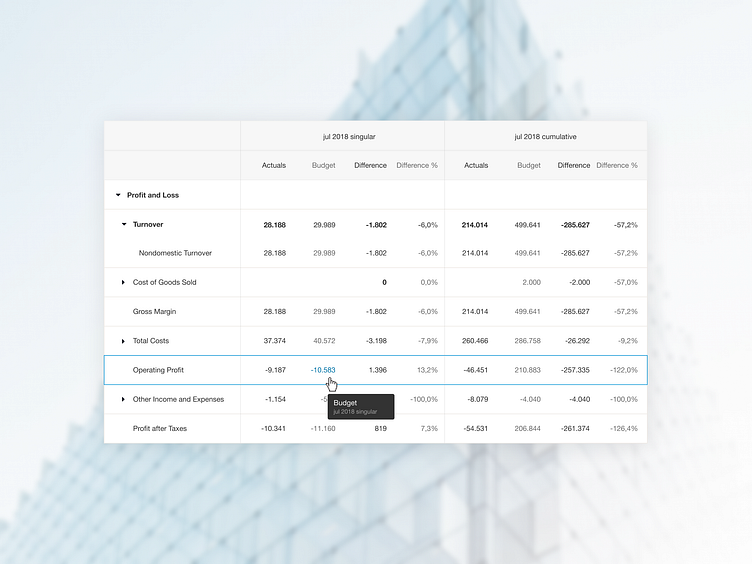
Table showing nested financial data. Tooltip shows details.
Selected row is highlighted via a boundary rectangle. The hovered number is blue as it is clickable to show the underlying calculation details.
Humans in the wild are using this design and seeing them use it makes me happy :-)
