That's Bob Caruthers.
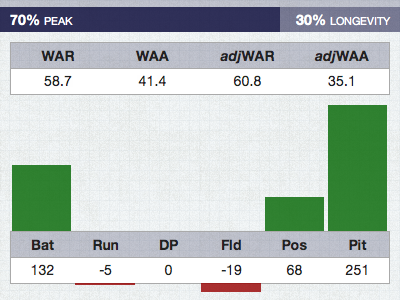
Updated table/bar chart hybrid.
The peak/longevity breakdown shows what percent of the player's WAR consisted of WAA.
Table below shows WAR and WAA as well as WAR and WAA after my own adjustments.
Then there's the run value breakdown table/graph. The components are:
Bat = Batting
Run = Baserunning
DP = Double Plays
Fld = Fielding
Pos = Position
Pit = Pitching
The graph displays runs above and below average. Caruthers could hit. Caruthers could pitch.