Population Influx Infographic | Data Design
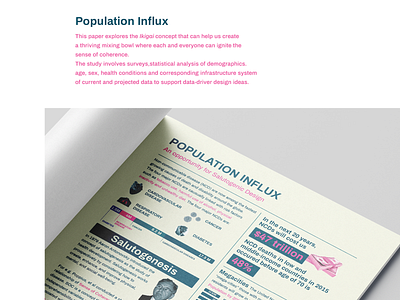
This infographic explores the Ikigai concept that can help us create a thriving mixing bowl where each and everyone can ignite the sense of coherence. The study involves surveys, statistical analysis of demographics. age, sex, health conditions and corresponding infrastructure system of current and projected data to support data-driver design ideas.
Check out the full case study on behance:
https://bit.ly/2phvFU3
Press "L" to show some love
