#087 Tooltip
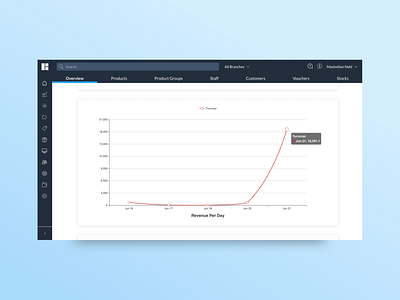
A graph representing the revenue per day, the user can access the detail of the data by hovering or clicking on the dot.
A graph representing the revenue per day, the user can access the detail of the data by hovering or clicking on the dot.