Infographics- Pie chart visualization
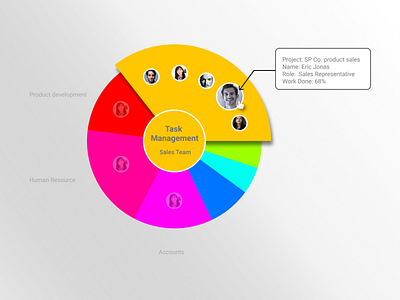
Infographics- Pie chart visualization Showing task management of all departments in pie chart form. Each color represents different departments having employees and their brief in a label.
#027 #dailyUIdesignchallenge
