Conference Data Visualization
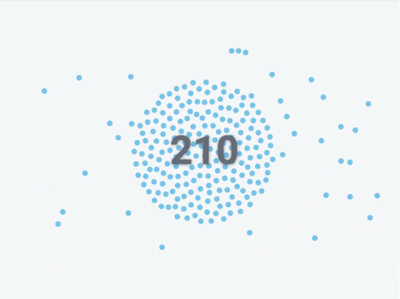


Data visualization designed to engage and gather a pulse on the audience during conference talks. If the audience agrees with the speaker an event is triggered via a web app and a circle is created while the user count is updated. Each circle represents an audience participant. Click on the attachments to see it in action.