Daily UI | Challenge #18 | Analytics Chart
I got to the internet to understand better about the best way to present information in a graphic.
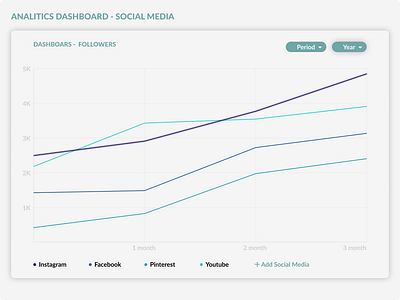
So my thought was to create a web app with information about the social media that a company have and understand the evolution of followers in social media.
The graphic shows the number of followers in the social media that the business has accounts.
Again, I had a hard time with colors and typography :(
Tips or suggestions are well welcome! :)
More by Martin Patz View profile
Like
