Income and Employment Deprived Infographic
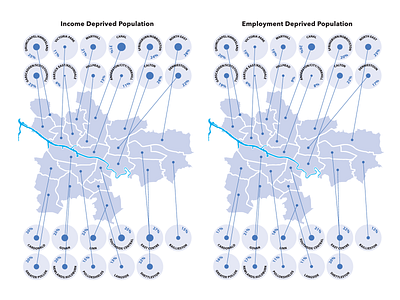
I created an Infographic for a publication on Child Poverty and Deprivation. It displays all 23 Wards of Glasgow. By means of a 100% circle for each Ward, I then used another circle to display the percentage of that Ward that are experiencing problems with Income and employment Deprivation. The purpose is to engage the viewer and also give them an instant visual meter of this problem within Glasgow. hope I have succeeded in attempting this?